With the current energy prices in The Netherlands I wanted to get better grip on where my electricity was actually going to. In order to understand the consumption of various appliances I use 14 power plugs (3 times a Gosund SP-1 and 9 times a Gosund SP111 flashed with Esphome). I have a smart meter which I read via a Homewizard P1 plug.
As I also have quite a lot of Philips Hue bulbs I decided to also measure those with the help of the great plugin Powercalc which gives me an additional 10 measurements of consumption.
As I have solar panels I first have to create a sensor that shows the actual consumption of the house. The logic behind it is home consumption =(imported energy + solar production - exported energy). I do this via a template sensor:
  - platform: template
    sensors:
      calculated_energy_consumption_house:
        friendly_name: "Total calculated energy Consumption house"
        unit_of_measurement: 'kWh'
        value_template: "{{ states('sensor.p1_meter_3c39e72bf1a4_total_power_import_t1')|float + states('sensor.p1_meter_3c39e72bf1a4_total_power_import_t2')|float + (states('sensor.solaredge_lifetime_energy')|float /1000) - states('sensor.p1_meter_3c39e72bf1a4_total_power_export_t1')|float - states('sensor.p1_meter_3c39e72bf1a4_total_power_export_t2')|float }}"
The above value gets fed into a utility meter sensor which calculates the daily/mothly/yearly value:
utility_meter:
  daily_calculated_energy_consumption_house:
    source: sensor.calculated_energy_consumption_house
    cycle: daily
  monthly_calculated_energy_consumption_house:
    source: sensor.calculated_energy_consumption_house
    cycle: monthly
  yearly_calculated_energy_consumption_house:
    source: sensor.calculated_energy_consumption_house
    cycle: yearly
Now onto the powerplugs: each powerplug produces the power value (ie: how much Watts is being consumed). This value gets fed into a Riemann Sum sensor (to calculate the energy consumption) which then gets fed into a utility meter sensor. Find below the example for 1 power plug.
sensor:
  - platform: integration
    unique_id: 5961ce29-02bd-4bfa-b038-b0285546cbf1
    source: sensor.eettafel_stopcontact_power
    round: 2
    method: left
utility_meter:
  utility_meter_eettafel_stopcontact_daily:
    source: sensor.sensor_eettafel_stopcontact_power_integral
    cycle: daily
  utility_meter_eettafel_stopcontact_monthly:
    source: sensor.sensor_eettafel_stopcontact_power_integral
    cycle: monthly
  utility_meter_eettafel_stopcontact_yearly:
    source: sensor.sensor_eettafel_stopcontact_power_integral
    cycle: yearly
Now, as a bonus, it is time to add the Riemann Sum or Integration sensors to Energy Dahboard (NOT the utility meters!). If that’s done correctly it will produce the below:

As a next step I wanted to know what part of my total consumption I was actually measuring. In order to do so I created a template sensor which sums up the power consumption (ie: Watt) values of all the individual sensors, feed that into a Reimann Sum integration sensor and feed that into a utility sensor. In order to keep things tidy I will only show 2 sensors.
sensor:
  - platform: template
    sensors:
      measured_power:
        friendly_name: "Measured power consumption"
        unit_of_measurement: 'W'
        value_template: "{{ states('sensor.3d_printer_power')|float + states('sensor.cvketel_power')|float }}"
  - platform: integration
    source: sensor.measured_power
    name: Measured power energy
    unit_prefix: k
    round: 2
    method: trapezoidal
utility_meter:
  daily_calculated_energy_consumption_house:
    source: sensor.calculated_energy_consumption_house
    cycle: daily
  monthly_calculated_energy_consumption_house:
    source: sensor.calculated_energy_consumption_house
    cycle: monthly
  yearly_calculated_energy_consumption_house:
    source: sensor.calculated_energy_consumption_house
    cycle: yearly
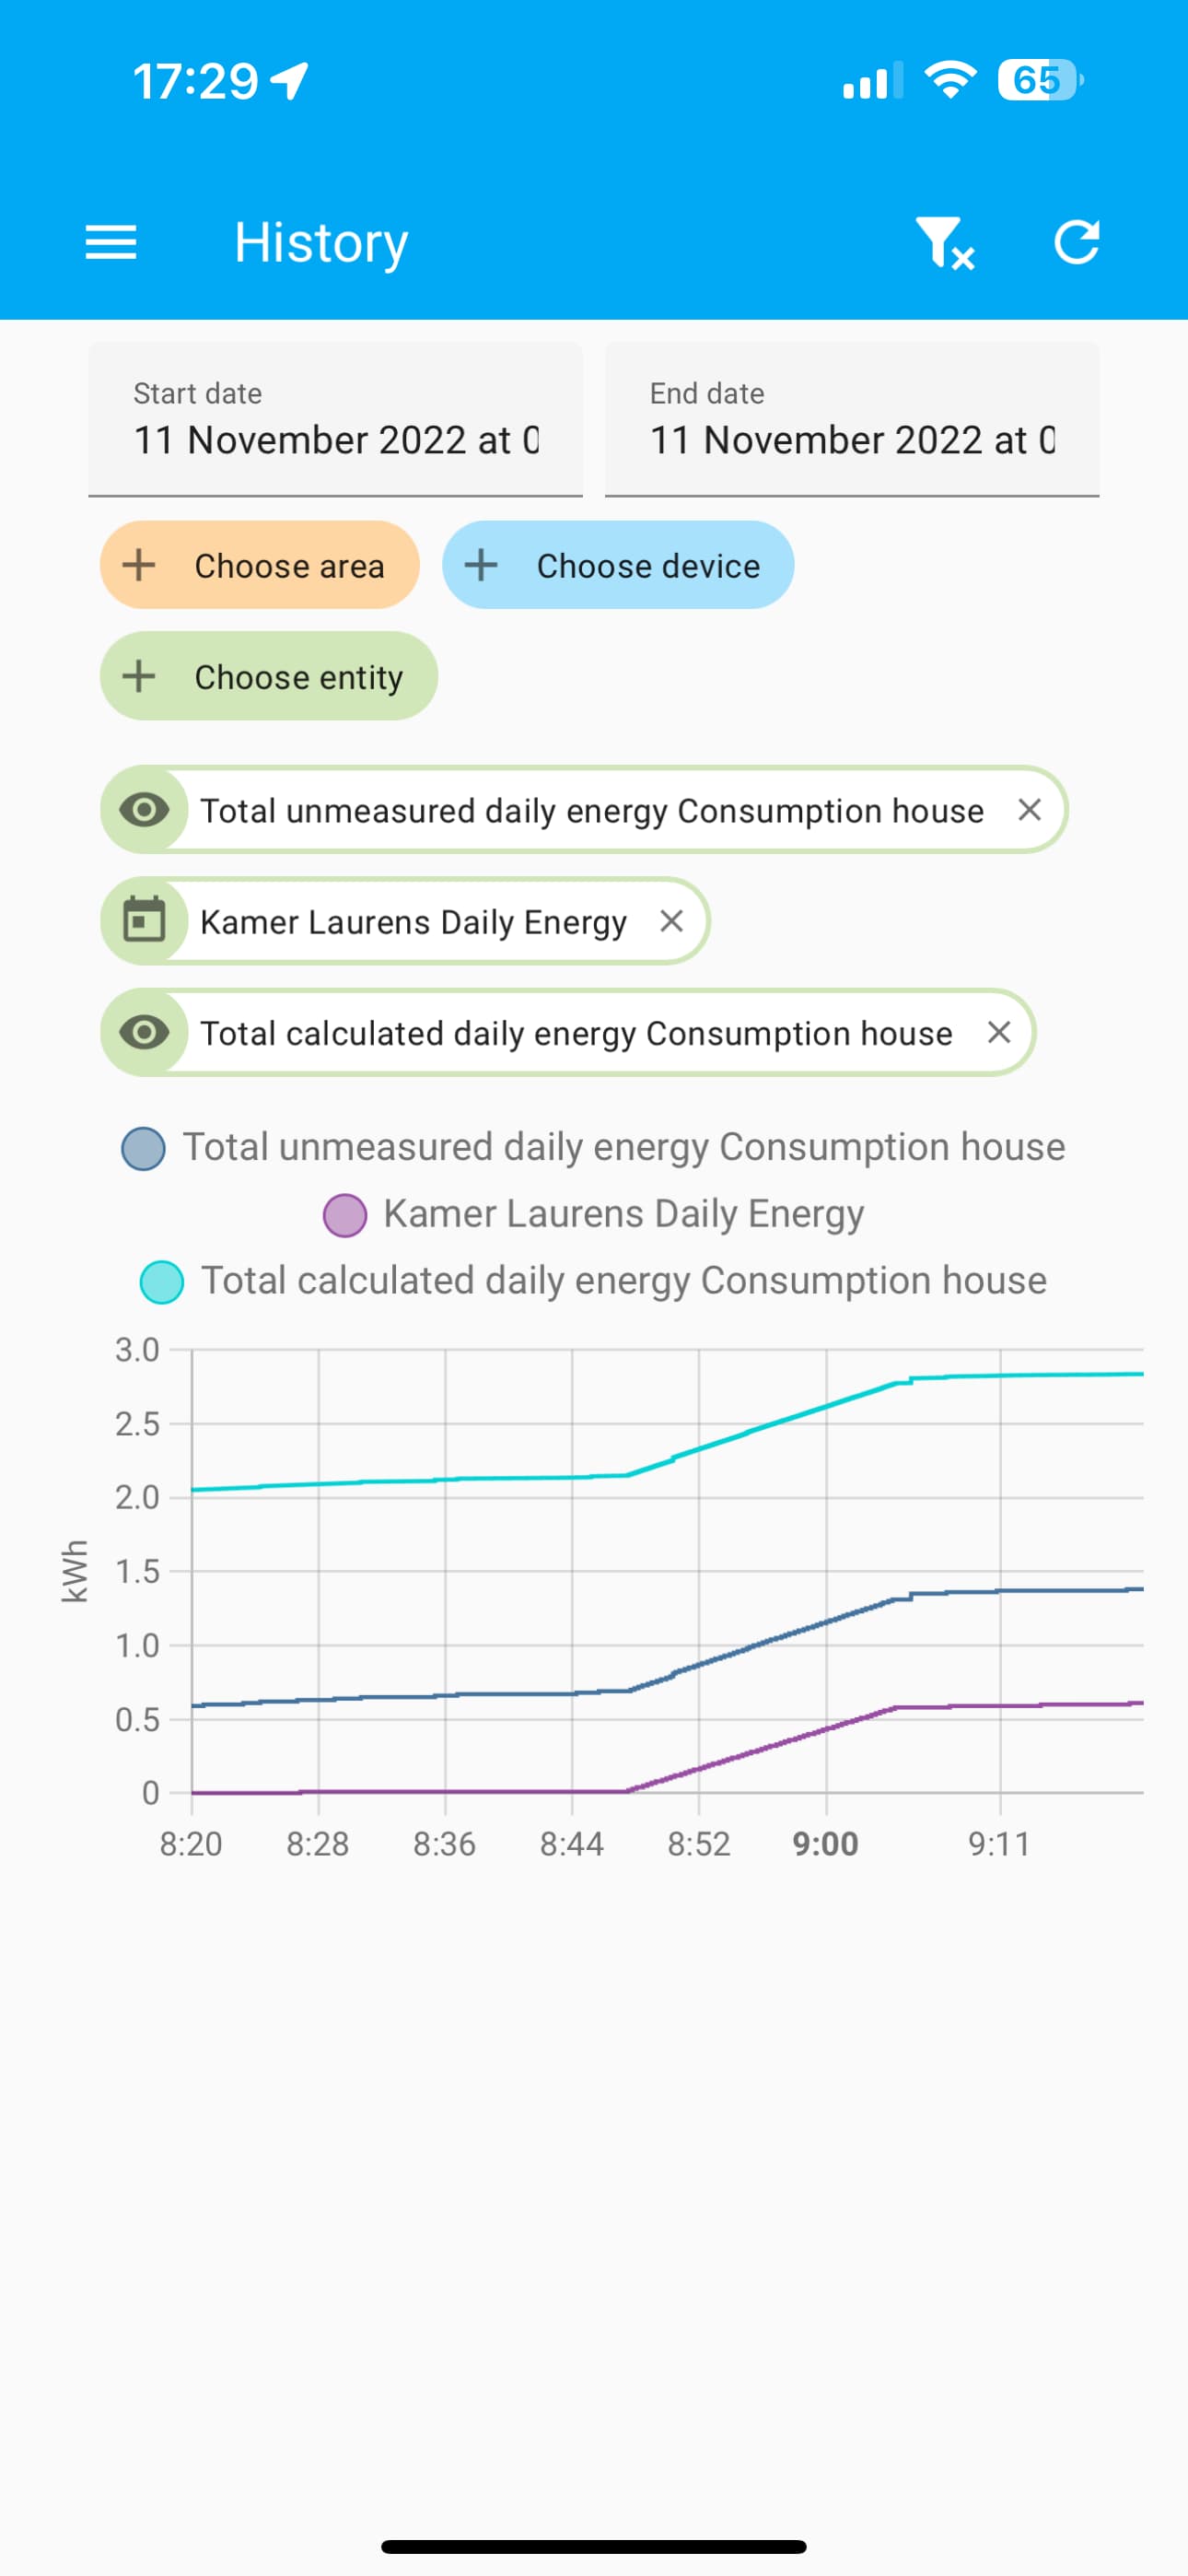
Now I can create cool graphs like the below:

As I have so many power plugs it should however show me almost all power consumption, but by judging from the gap between the above lines I measured only about 75% of my power consumption. In order to track this a bit better I created a template sensor which shows my unmeasured power consumption:
sensor:
  - platform: template
    sensors:
      unmeasured_daily_energy_consumption_house:
        friendly_name: "Total unmeasured daily energy Consumption house"
        unit_of_measurement: 'kWh'
        value_template: "{{ (states('sensor.daily_calculated_energy_consumption_house')|float - states('sensor.utility_meter_measured_power_daily')|float) | round(2) }}"
Now I can track both the power consumption of the entire house AND the unmeasured energy consumption in real time:

Now the morale of the whole story: I think I need to calibrate my power plug better. The line between “Daily calculated” and “Total unmeasured daily energy Consumption house” looks so very similar that I suspect that the delta is caused by my power plugs being a bit off. Will post an update as soon as I have managed to go through the tedious process of calibrating all of them. How? That has been clearly descibed by @frenck at: Calibrating an ESPHome flashed power plug » Frenck.dev
Hope this write up helps others in hunting down their energy consumption.