I try to keep relatively current with the HA releases. A couple of weeks ago I did an update and you can see from the following that I now have a memory leak issue.

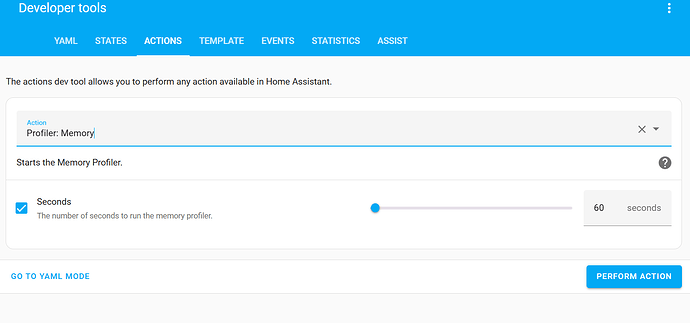
I was hoping maybe one of the more recent updates would fix it, but no go. I then attempted to use the memory profiler via the developer tools screen:
When I first attempted to use the memory profiler I was getting some errors related to openai, so I removed the openai stuff I was playing with under voice assistance. That cleared the openai error, but still doesn’t allow the memory profiler to run. When I start the memory profiler now it simply causes the HA python process to kick to 100% CPU for about 5 minutes, with no memory profile output being generated.
I’m using a supervised install of HA running on Debian bookworm on an odroid N2+ SBC.
Does anyone have input on how to get the memory profiler to run and generate some output. I used it in the past and was able to discover the component with the memory leak. Any suggestion on things to try would be appreciated. Maybe there is a way to get the memory profiler to output some log messages?
Kicked the memory profiler off about 3 minutes ago and here you can see the HA python process pegging a CPU at 100%, with the web interface spinning as it waits for any kind of response back from the HA server.
I’m ready and willing to help debug this HA issue, if I could just use some guidance on how to get HA to spit out something related to the issue.
Turns out with the CPU pegged HA will actually die and restart. Nothing useful in the logs.
At some point in this process this error shows up on the GUI
Using the command
docker logs hassio_supervisor
the entries show where the supervisor can’t communicate with HA core and so it is what ends up restarting HA. No other useful information in that log.
The log entries showing supervisor restarting HA core:
2024-08-29 20:14:34.559 INFO (MainThread) [supervisor.updater] Fetching update data from https://version.home-assistant.io/stable.json
2024-08-29 20:14:43.307 INFO (MainThread) [supervisor.api.proxy] Home Assistant WebSocket API error: Cannot proxy websocket message of unsupported type: 257
2024-08-29 20:14:43.308 INFO (MainThread) [supervisor.api.proxy] Home Assistant WebSocket API for a0d7b954_appdaemon closed
2024-08-29 20:15:13.312 ERROR (MainThread) [supervisor.homeassistant.api] Timeout on call https://172.30.32.1:8123/api/core/state.
2024-08-29 20:15:13.313 WARNING (MainThread) [supervisor.misc.tasks] Watchdog missed an Home Assistant Core API response.
2024-08-29 20:15:19.308 ERROR (MainThread) [supervisor.homeassistant.api] Timeout on call https://172.30.32.1:8123/api/core/state.
2024-08-29 20:15:55.335 ERROR (MainThread) [supervisor.homeassistant.api] Timeout on call https://172.30.32.1:8123/api/core/state.
2024-08-29 20:16:31.333 ERROR (MainThread) [supervisor.homeassistant.api] Timeout on call https://172.30.32.1:8123/api/core/state.
2024-08-29 20:17:07.309 ERROR (MainThread) [supervisor.homeassistant.api] Timeout on call https://172.30.32.1:8123/api/core/state.
2024-08-29 20:17:43.312 ERROR (MainThread) [supervisor.homeassistant.api] Timeout on call https://172.30.32.1:8123/api/core/state.
2024-08-29 20:17:44.305 ERROR (MainThread) [supervisor.homeassistant.api] Timeout on call https://172.30.32.1:8123/api/core/state.
2024-08-29 20:17:44.305 ERROR (MainThread) [supervisor.misc.tasks] Watchdog missed 2 Home Assistant Core API responses in a row. Restarting Home Assistant Core!
2024-08-29 20:17:44.313 INFO (SyncWorker_7) [supervisor.docker.manager] Restarting homeassistant
Sadly the memory just keeps leaking, all the drop downs are restarts.


