Hello.
Does anybody else faced to memory leaks of HA starting from 2022.7 release on raspberry with supervisor ?
I know my configuration unsupported, but before 2022.7 was didn’t noticed memory leaks.

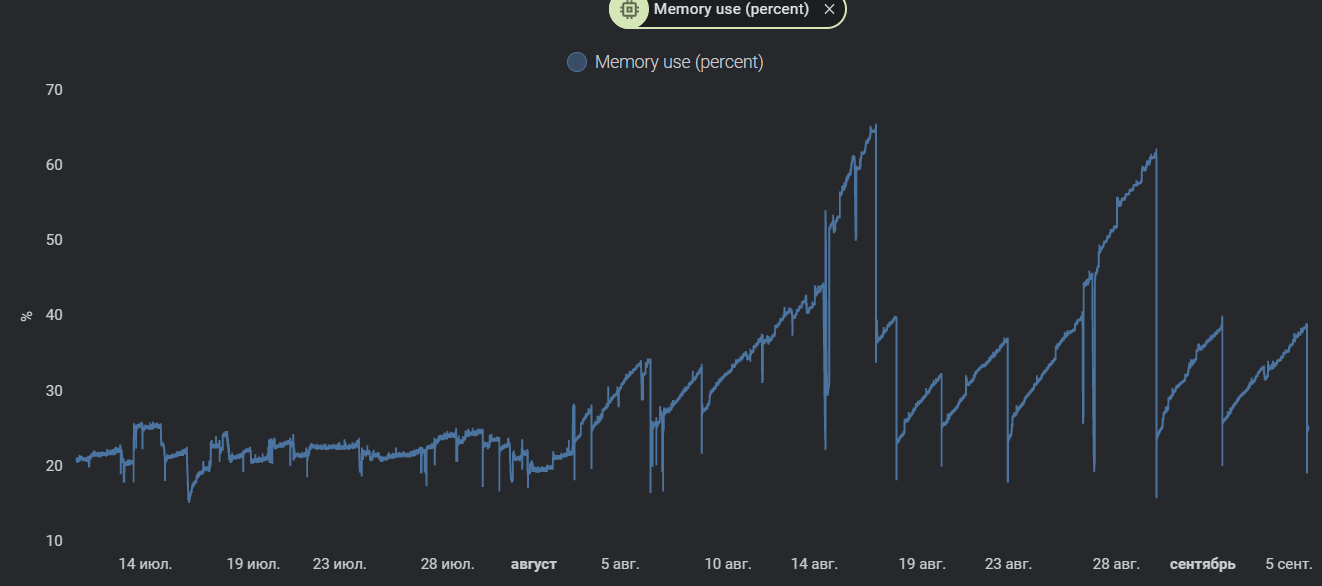
Mine looks this, you can notice that from August (I’ve migrate to 2022.7) begun memory leaks.
Process “python3 -m homeassistant --config /config” growing all the time, then it self’s restarts HA and again, again, again …!
Curently on 2022.8.7 the same leaks.
Disable your integrations, starting with custom integrations, until you find the culprit.
Thanks! Will try your advise and respond later.
I had the issue. In the end I wrote an automation to kill off the rogue “python3 -m homeassistant --config /config” processes. I can share it if you want?
I even raised it as an issue but it’s gone stale.
Thanks Neil!
But I think more elegant solution in this case will be just restart Home Assistant instance, by the way it’s possible by automation too I believe.
P.S. just to continue automation idea - there poss to use condition with free memory level left for restart.
My solution stops it before it is an issue and there’s no need to restart anything.
So you need this to count the instances :
  - platform: command_line
    name: ha_instances
    command: pgrep -f 'python3 -m homeassistant --config /config' | wc -l
    scan_interval: 60
Then this to kill the rogue …
shell_command:
  kill_rogue_ha: pgrep -f 'python3 -m homeassistant --config /config' |awk 'NR >= 2' | xargs -n1 kill -9
…and finally the automation :
alias: Kill Rogue HA Instances
description: ""
trigger:
  - platform: template
    value_template: "{{ states('sensor.ha_instances')| int -1 > 1}} "
condition: []
action:
  - service: shell_command.kill_rogue_ha
    data: {}
  - delay:
      hours: 0
      minutes: 0
      seconds: 30
      milliseconds: 0
mode: single
2 Likes
Looks like you was definitely right, one custom integration has memory leak. When I deactivate this component, memory leak stops.
Thanks a lot!
Would you mind sharing, which one was guilty?
Looks like I was too hasty with my conclusions. After deactivation of custom components, memory leak continued with the same pace. So from my point of view, leak may be in HA instance it self.
Any body can guide me with a Profiler integration to find the source of leakage ?

Some errors I got after enabling Profiler.memory in logs.
22-09-07 09:26:25 ERROR (MainThread) [supervisor.homeassistant.api] Error on call http://172.30.32.1:8123/api/config:
22-09-07 09:26:25 ERROR (MainThread) [supervisor.misc.tasks] Watchdog found a problem with Home Assistant API!
22-09-07 09:26:25 ERROR (MainThread) [supervisor.homeassistant.api] Error on call http://172.30.32.1:8123/api/config:
22-09-07 09:26:25 INFO (SyncWorker_7) [supervisor.docker.interface] Restarting ghcr.io/home-assistant/raspberrypi4-homeassistant
22-09-07 09:28:37 ERROR (MainThread) [supervisor.homeassistant.api] Error on call http://172.30.32.1:8123/api/config:
22-09-07 09:30:06 WARNING (MainThread) [supervisor.homeassistant.websocket] Connection is closed
I got data from Profiler, can anybody help with analyzing it pls?
Downgraded to the 2022.6.7, so far it more stable then latest releases in regard of memory usage (as you might notice on the picture).

I’m not sure if this is the same issue or not, but I noticed a memory leak after upgrading from 2022.7.x, and it appears to be my zwave addon. After restoring to an older snapshot (2022.7.x, os 8.4, zwave 1.69(?)) my mem leak stopped and was stable.
I then just upgraded to 2022.9.4 and the mem leak snuck back up. I have an automation to restart my zwave addon when it reaches X percent used… not idea, but workable.
1 Like
Thanks @csjo for your experience, in my case the addons didn’t change with HA upgrades (and neither did yours), this gives reason to believe that the addons is not the cause of memory leak (HA core, python version, I have no idea what is the reason).
I’m currently pressed to stay on 2022.6.7 and investigating further.
I’ve also been experiencing some memory leak issues. I am running HA OS 9.0 with HA 2022.9.7, but this started around the same timeframe as this thread is discussing. I run HA in a Proxmox VM and memory usage as displayed by Proxmox indicates a steady climb until all 8GB I have allocated is used. Of course HA dies at that point so I’ve begun rebooting.
I have not found an offending addon or integration as yet. Also the new feature that shows the memory usage in the System - Hardware does not appear to be accurate or I may be expecting that graph to show the entire system and it is just showing a portion.
If I restart HA, not the OS, my memory usage doubles from whatever the current is in Proxmox. Only when I reboot the host do I see the used memory freed up.
Have you tried my hack (above)?
Not yet, so far its slow enough I’ve been doing it manually so I can try to figure out what is causing it
For me this got solved by recent updates of Zwave JS 
@codemannh thanks for your experience, I’ve been hoped that new releases can solve this issue.
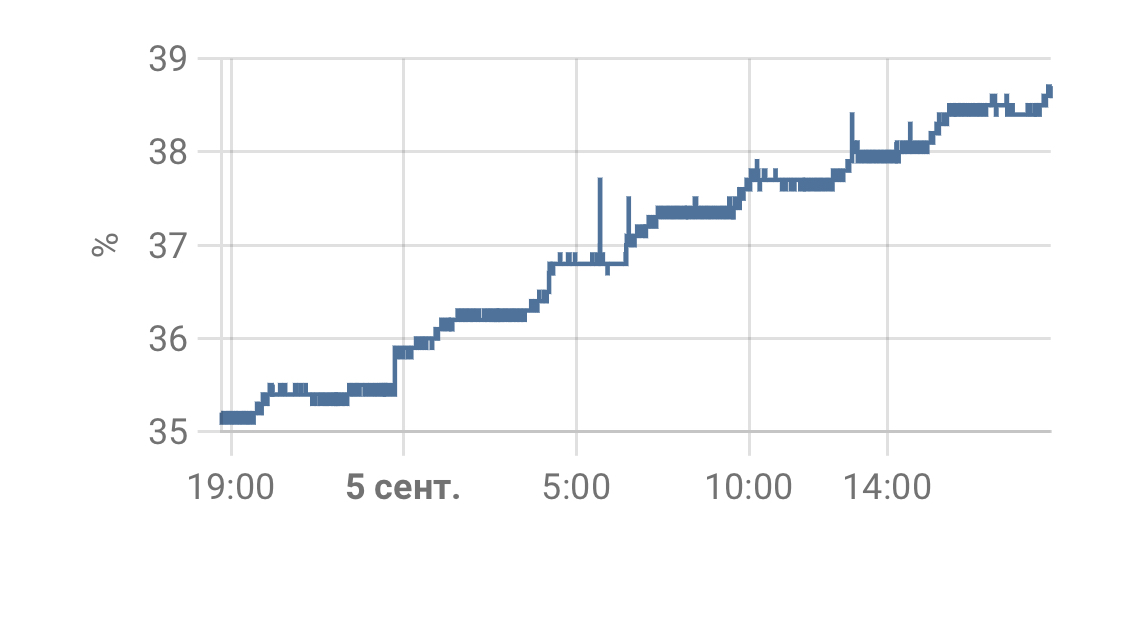
Staying still on 2022.6.7 - memory usage so far holding stable at 25-28%.
For me triggered exactly version of HA, not any others addons.
Fingers crossed the issue may be noticed by developers.
Here will be my current memory usage graph (2022.6.7)
