Vartkat
January 29, 2022, 12:27pm
1
Posted as ref if anyone interested.
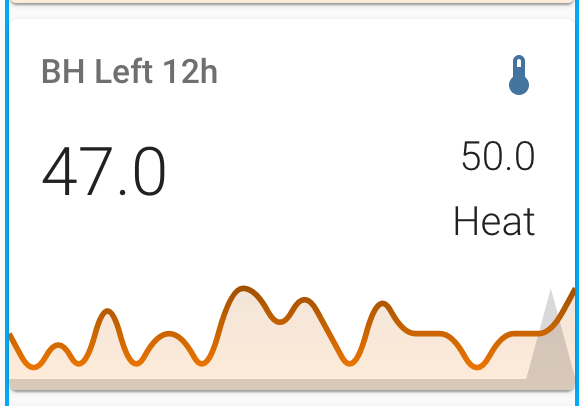
I’m quite sure it’s not optimal but at least it acheive what I wanted :
current temp graph
current temp number
target temp number
hvac mode as text
hvac mode as graph
entities:
  - entity: climate.boathouse_left
    attribute: current_temperature
    name: Current
  - entity: climate.boathouse_left
    attribute: temperature
    show_state: true
    show_graph: false
    fixed_value: true
  - entity: climate.boathouse_left
    show_state: true
    show_graph: true
    color: black
    show_line: false
    show_points: false
    show_legend: false
    y_axis: secondary
    smoothing: false
state_map:
  - value: heat_cool
    label: Heat Cool
  - value: heat
    label: Heat
  - value: cool
    label: Cool
  - value: 'off'
    label: 'Off'
  - value: fan_only
    label: Fan Only
icon: mdi:thermometer
name: BH Left 12h
type: custom:mini-graph-card
points_per_hour: 2
aggregate_func: max
hours_to_show: 12
decimals: 1
color_thresholds:
  - value: 50
    color: red
  - value: 45
    color: '#ff7f00'
  - value: 41
    color: blue
I’m sure it can be optimized so anyone is welcome to post better solution.
Hope this helps
V.
tom_l
January 29, 2022, 12:33pm
2
I do something similar:
The thresholds come from automations (input_numbers) and the “active” sensor is a template binary sensor that monitors the power.
I didn’t actually have one of the automations on until I noticed it was sweltering inside a couple of days ago.
I also usually only display 24 hours but haven had to run the heat pump today (I opened the windows to cool) so I extended it out to 96 hours just to see the binary sensor.
1 Like
Vartkat
January 29, 2022, 12:39pm
3
Really nice, can you post your code ?
tom_l
January 29, 2022, 1:34pm
4
The card:
color_thresholds:
  - color: '#e45e65'
    value: 28
  - color: '#e0b400'
    value: 23
  - color: '#0da035'
    value: 18
  - color: '#039BE5'
    value: -50
color_thresholds_transition: hard
entities:
  - entity: sensor.lounge_room_temperature
    show_fill: false
    name: Temperature
  - entity: climate.upstairs
    attribute: temperature
    name: Set Temperature
    color: rgb(178,0,255)
    show_fill: false
  - color: rgb(255,128,0)
    entity: binary_sensor.upstairs_heat_pump_active
    show_line: false
    show_fill: true
    y_axis: secondary
    name: Heat Pump Active
  - color: rgb(255,0,0)
    entity: input_number.upstairs_ac_heat_temp_set
    show_fill: false
    name: Heat Threshold
  - color: rgb(0,0,255)
    entity: input_number.upstairs_ac_cool_temp_set
    show_fill: false
    name: Cool Threshold
group: false
hour24: true
hours_to_show: 24
line_width: 2
name: Upstairs Climate
points_per_hour: 60
show:
  average: true
  extrema: true
  fill: none
  icon: true
  labels: false
  name: true
  state: true
  points: false
state_map:
  - label: 'Off'
    value: 'off'
  - label: 'On'
    value: 'on'
type: custom:mini-graph-card
The binary sensor:
template:
  - binary_sensor:
      - name: "Upstairs Heat Pump Active"
        state: "{{ states('sensor.upstairs_heat_pump_power')|float(0) > 200 }}"
1 Like
mlw05
February 8, 2022, 2:05pm
6
I’ve been trying to do the same thing but my needs are more basic. Might be useful anyway:
Card code:
type: custom:mini-graph-card
height: 400
show:
  icon: false
  labels: true
  name: false
  state: true
  legend: true
  points: hover
upper_bound: ~21
lower_bound: ~16
smoothing: false
points_per_hour: 6
hours_to_show: 24
labels_secondary: true
align_state: center
align_header: center
entities:
  - entity: climate.thermostat_1
    attribute: current_temperature
    unit: °C
    name: Current Temp
    show_fill: false
  - entity: climate.thermostat_1
    attribute: temperature
    show_state: true
    unit: °C
    name: Target Temp
    show_fill: false
  - entity: binary_sensor.heating_on
    color: '#cccccc'
    name: Heating
    show_line: false
    y_axis: secondary
    show_points: false
    show_legend: false
min_bound_range: 5
state_map:
  - value: 'off'
    label: Idle
  - value: 'on'
    label: Heating
Heating state sensor code:
binary_sensor:
  - platform: template
    sensors:
      heating_on:
        value_template: >-
          {{ is_state_attr('climate.thermostat_1', 'hvac_action', 'heating') }}
1 Like


