Hi,
can you please give me some hints on how to configure this charts with wind direction

?
Thanks
I’m hoping someone knows how to resolve the following issue:
I have several mini-graph-cards in a hoizontal stack. They look great but I’ve noticed that the lates graph plot, which is within a minute different from real time, has a substantially different value that what is shown by the entity on the card.
Here is my layout:
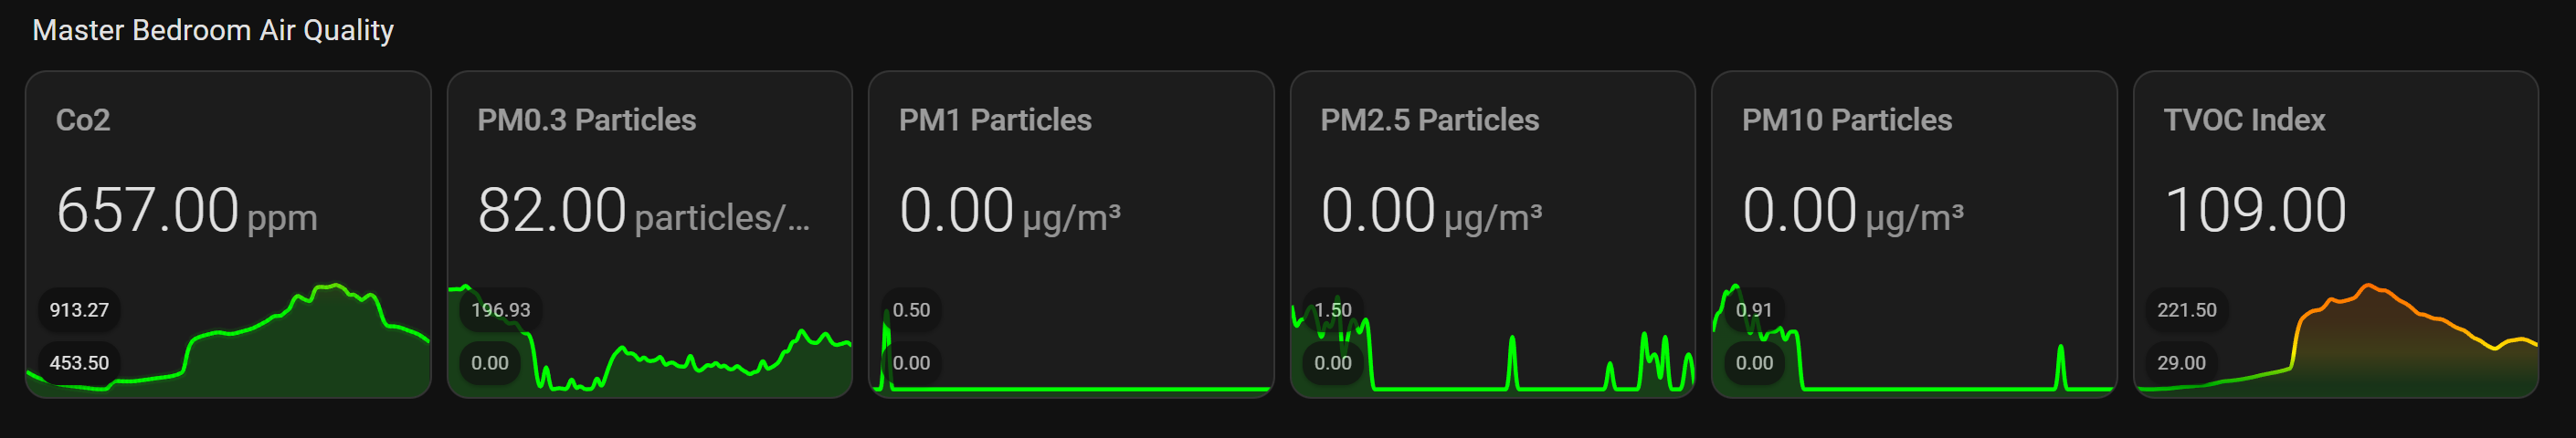
Here is an example:
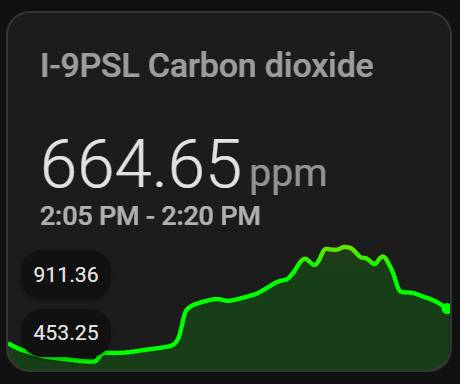
This image shows what the graph is currently showing:
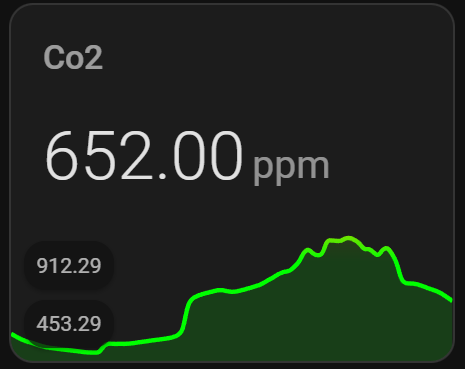
This image shows what the entity value is at the same time:
My guess is that part of the graph is beyond the right border of the card.
Here is my YAML:
square: false
type: grid
cards:
  - type: custom:mini-graph-card
    name: Co2
    entities:
      - sensor.i_9psl_carbon_dioxide
    show:
      labels: true
      icon: false
    true hours_to_show: 25
    points_per_hour: 4
    decimals: 2
    height: 150
    color_thresholds:
      - value: 3001
        color: "#ff0000"
      - value: 3000
        color: "#ff3300"
      - value: 2000
        color: "#ff5500"
      - value: 1500
        color: "#ff8400"
      - value: 1000
        color: "#ffbf00"
      - value: 800
        color: "#00ff00"
      - value: 0
        color: "#00ff00"
  - type: custom:mini-graph-card
    name: PM0.3 Particles
    entities:
      - sensor.i_9psl_pm0_3
    show:
      labels: true
      icon: false
    true hours_to_show: 25
    height: 150
    points_per_hour: 4
    decimals: 2
    color_thresholds:
      - value: 3001
        color: "#ff0000"
      - value: 3000
        color: "#ff3300"
      - value: 2000
        color: "#ff5500"
      - value: 1500
        color: "#ff8400"
      - value: 1000
        color: "#ffbf00"
      - value: 800
        color: "#00ff00"
      - value: 0
        color: "#00ff00"
  - type: custom:mini-graph-card
    name: PM1 Particles
    entities:
      - sensor.i_9psl_pm1
    show:
      labels: true
      icon: false
    true hours_to_show: 25
    height: 150
    points_per_hour: 4
    decimals: 2
    color_thresholds:
      - value: 41
        color: "#ff0000"
      - value: 40
        color: "#ff3300"
      - value: 30
        color: "#ff5500"
      - value: 20
        color: "#ff7700"
      - value: 15
        color: "#ff9900"
      - value: 10
        color: "#ffa203"
      - value: 5
        color: "#ffbf00"
      - value: 4
        color: "#ddff00"
      - value: 3
        color: "#00ff00"
      - value: 1
        color: "#00ff00"
      - value: 0
        color: "#00ff00"
  - type: custom:mini-graph-card
    name: PM2.5 Particles
    entities:
      - sensor.i_9psl_pm2_5
    show:
      labels: true
      icon: false
    true hours_to_show: 25
    height: 150
    points_per_hour: 4
    decimals: 2
    color_thresholds:
      - value: 8
        color: "#ff0000"
      - value: 7
        color: "#ff9100"
      - value: 6
        color: "#eeff00"
      - value: 5
        color: "#00b300"
      - value: 4
        color: "#00ff00"
      - value: 0
        color: "#00ff00"
  - type: custom:mini-graph-card
    name: PM10 Particles
    entities:
      - sensor.i_9psl_pm10
    show:
      labels: true
      icon: false
    true hours_to_show: 25
    height: 150
    points_per_hour: 4
    decimals: 2
    color_thresholds:
      - value: 45
        color: "#ff0000"
      - value: 30
        color: "#ff7700"
      - value: 20
        color: "#ff8c00"
      - value: 15
        color: "#fff000"
      - value: 10
        color: "#00b300"
      - value: 0
        color: "#00ff00"
  - type: custom:mini-graph-card
    name: TVOC Index
    entities:
      - sensor.i_9psl_voc_index
    show:
      labels: true
      icon: false
    true hours_to_show: 25
    height: 150
    points_per_hour: 4
    decimals: 2
    color_thresholds:
      - value: 300
        color: "#ff0000"
      - value: 200
        color: "#ff7700"
      - value: 150
        color: "#ff8c00"
      - value: 100
        color: "#fff000"
      - value: 50
        color: "#00b300"
      - value: 0
        color: "#00ff00"
columns: 6
grid_options:
  columns: 36
  rows: auto
This is a proper place to ask questions.
As a starting point:
- increase points_per_hour
- set smoothing: false
- set aggregate_func: last
- for simplicity - exclude color_thresholds temporarily
Also ,there is a registered issue about “last point on a graph does not conform a current state”, you can find it in github.
Suggest to continue this discussion in a proper thread.