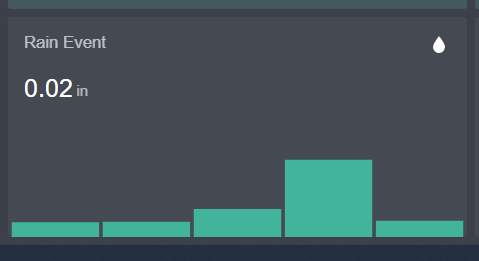
I am using the mini-graph-card to create the following graph from my rain gauge. It looks like this.

I want it to look more like this, with the values over each bar.
Does anyone have an idea if this can be done?
I am using the mini-graph-card to create the following graph from my rain gauge. It looks like this.

I want it to look more like this, with the values over each bar.
Does anyone have an idea if this can be done?
It cannot currently be done by mini-graph-card, but you could try ApexCharts. It has a lot of control over dataLabels.