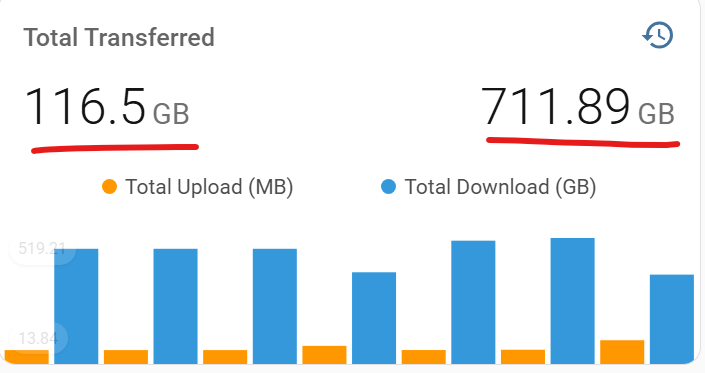
The value of my mini graph per i post this thread is 711.89 GB and 116.5GB
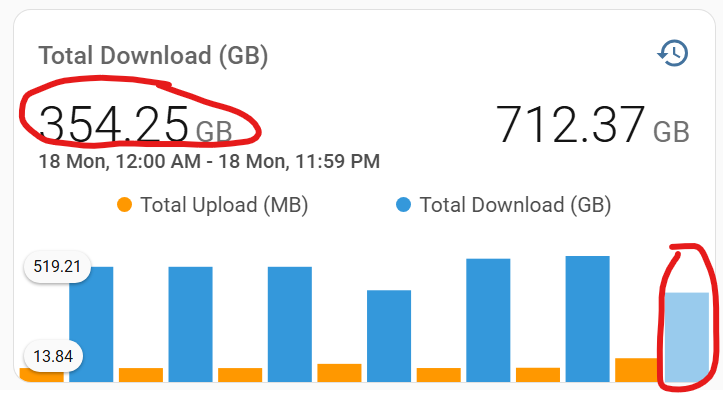
But when i move my cursor to the bar why the value is different? Today value showing 354.25 GB and not 711.89 GB or 712.37 GB? From hwre 354.25 come?
If i move to yesterday the value showing 519.21 GB, but actually yesterday data is more than 1000 GB.
Suggest to use the existing dedicated thread for this card. And always post a properly formatted code. People usually cannot guess what you coded without looking at a code. You probably using grouping and aggregation, check docs.
Lovelace: mini-graph-card
A minimalistic and customizable graph card for Home Assistant Lovelace UI.
The card works with entities from within the sensor domain and displays the sensors current state as well as a line graph representation of the history.
[Preview]
Instructions
Please visit the GitHub repository for installation and usage instructions.
Let me know if you have any questions, issues or suggestions!