I don’t have much operational experience with the Mosquitto server yet, but figured someone might have already played with this and might have something worth sharing.
(*) Everything I try turns up tons of pages with various MQTT sensors, I haven’t figured out how to get results relevant to monitoring the mosquitto sensor itself.
I am looking forward to some of the diagnostics tools coming in upcoming HA releases. I things being able to see how many states changes, events, rates and other things and sizes of things that are traveling around the HA backbone will be useful. It is very easy to add sensors and stuff and then forget about them or not realize their performance impact.
I monitor recorder writes per minute as a metric of operation and operations deltas in my system currently.
As an example of unintended consequences, I have a group of 8 bluetooth low energy sensors that changed their reporting rate by factor of 50 due to a changing location of the hub that collects their readings. Not better data, the sensors in the devices were still sampling at the same rate, the BLE device was just sending the same value 50 extra times… and since the time stamp or some other less useful data was changing, HA was recording all the data.
@dproffer - thank you that is exactly the kind of thing I was looking for.
I wasn’t aware recorder metrics are available. In the past I’ve had a problem because of high HA write rates causing excessive disk latency. Granted it was an RPI 3 SD card install but I was at a loss to explain what parts of my config were generating those writes.
Can you share how you are monitoring recorder? Thanks
I have my recorder external with Postgresql running in a Docker container in parallel with my HA in another Docker container. So I just monitor the HA databases with standard SQL. You could so something like that with AppDaemon running in another Docker container and use AppDaemon time functions to create regular reports and push them back into HA as a sensor ( :-; ) or HTML table report or… on a simpler route, as it sounds like you may be using SQLite native Recorder, HA has a SQL sensor. Good hunting.
Just as a simple example, writes to states table per hour:
SELECT
    date_trunc(:zinterval, last_updated) AS updated,
    count(1)
FROM
    states
WHERE (last_updated > date_trunc(:zinterval, now()) - interval :zperiod)
    AND last_updated < date_trunc(:zinterval, now())
GROUP BY
    1
ORDER BY
    updated DESC;
To grab data from log files I use the telegraf agent and the tail plugin as part of my ‘TIG’ stack (Telegram,Influxdb&Grafana). This puts the metrics into influxdb which can be disaplyed in Home Assistant using the influxdb component
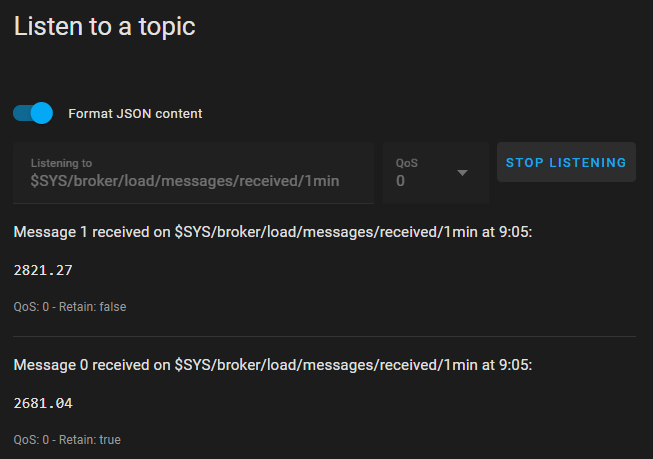
Ive never been able to monitor $SYS to have it as a sensor
i have many other mqtt sensors but when i create one for $SYS anything… i get nada.
Dont suppose anyone knows why ?
haha i know the topics, i thought i could put them into 1 entity as json values into attributes.
i didnt want an entity for each.
i expected # to return a json set