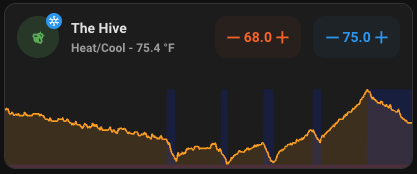
Mushroom climate card to control my EcoBee (3, Lite) combined with (via vertical-stack-in-card) a mini-graph-card showing the average house temp and when the AC is on. Would also show the heater (that’s the red line at the bottom) but I don’t normally get to see both in a single day. The heater/AC on trackers are binary sensor helpers set up in the configuration.yml.

Lovelace:
type: custom:vertical-stack-in-card
cards:
  - type: custom:mushroom-climate-card
    entity: climate.the_hive
    fill_container: false
    icon: mdi:bee
    show_temperature_control: true
    collapsible_controls: false
    layout: horizontal
  - type: custom:mini-graph-card
    entities:
      - entity: sensor.house_temp
      - entity: binary_sensor.hvac_heating_on
        color: red
        show_line: false
        show_points: false
        show_legend: false
        y_axis: secondary
        smoothing: false
      - entity: binary_sensor.hvac_ac_on
        color: blue
        show_line: false
        show_points: false
        show_legend: false
        y_axis: secondary
        smoothing: false
    state_map:
      - value: 'off'
      - value: 'on'
    show:
      name: false
      state: false
      icon: false
    animate: true
    hour24: true
    hours_to_show: 12
    line_width: 2
    points_per_hour: 60
    smooth: true
configuration.yaml:
- platform: template
  sensors:
    hvac_heating_on:
      friendly_name: Heater On
      value_template: >-
        {{ is_state_attr('climate.the_hive', 'equipment_running', 'auxHeat1,fan') }}
    hvac_ac_on:
      friendly_name: AC On
      value_template: >-
        {{ is_state_attr('climate.the_hive', 'equipment_running', 'compCool1,fan') }}
- platform: template
  sensors:
    hvac_fan_on:
      friendly_name: Fan On
      value_template: >-
        {{ is_state_attr('climate.the_hive', 'fan', 'on') }}


