I’m trying to show stacked monthly totals of 2 sensor values and failing.
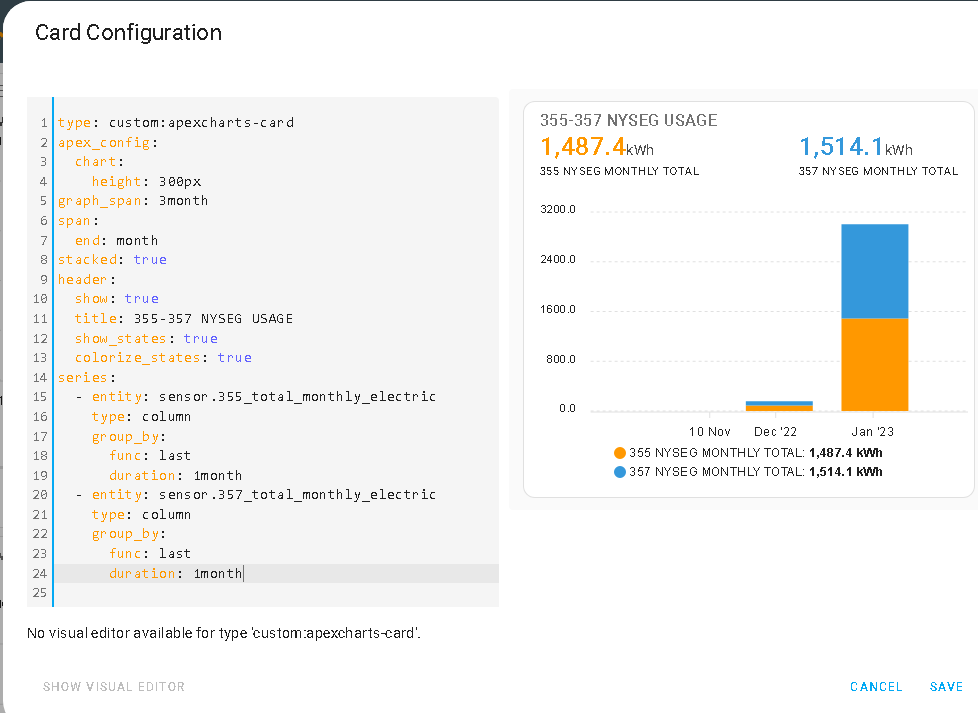
Image 1 below showing totals by month show December’s (last month’s) values incorrectly.
Image 2 showing totals by week show all correct values.
Here’s what I’ve got:


sensor.355_total_monthly_electric and sensor.357_total_monthly_electric are created in configuration.yaml:
  355_total_monthly_electric:
    friendly_name: "355 NYSEG MONTHLY TOTAL"
    unit_of_measurement: "kWh"
    value_template: "{{ states('sensor.blue_house_123_1mon') |float + states('sensor.green_559f0_123_1mon') | float }}"

  357_total_monthly_electric:
    friendly_name: "357 NYSEG MONTHLY TOTAL"
    unit_of_measurement: "kWh"
    value_template: "{{ states('sensor.shop_123_1mon') |float + states('sensor.purple_house_123_1mon') | float + states('sensor.white_house_123_1mon') | float}}"
Can someone tell me what I’m doing wrong?
Thank you!