Hi there,
This topic is about calculating net metering in real-time on HA with a small flow in nodered (that can easily be done only in HA because it’s a render template node)

Having lots of Utility Meters for tracking several energy consumption (grid, solar, returned, used as well as lots of specific devices) I wanted to have a real time value of net metering as calculated in the Portuguese E-Redes (don’t really know if it’s the same in some other countries), that is, 15 minutes net metering: deduce the injected energy in relation to the grid consumption in 15 minutes intervals:
If returned>grid consumption, the rest of the energy is considered “injected” and possibly sold.
If returned<grid consumption, it’s only considered the returned value in the net metering 15 min interval and the rest of the value is paid.
For that i use utility meters:
-
sensor.quarter_hourly_total_energy- grid consumption (shelly em on the main electrical board). -
sensor.quarter_hourly_return_to_grid- an utility meter with an automatic calculation with the returned energy (when solar is great than the house needs)
Before this net metering calculation I had no “quarter_hourly” sensor, only daily, monthly and yearly but I needed them for this 15 min calculation.
The Utility Meters I use:
# Shelly-EM-01 - Clamp #1
  quarter_hourly_total_energy:
    source: sensor.total_energy
    cycle: quarter-hourly

  quarter_hourly_return_to_grid:
    source: sensor.return_to_grid_calculated_kwh
    cycle: quarter-hourly
The sensors for the second utility meter:
  - platform: template
    sensors:
      return_to_grid_calculated:
        friendly_name: "Return to Grid - Calculated (power)"
        unit_of_measurement: 'W'
        icon_template: 'mdi:solar-power-variant'
        device_class: energy
        value_template: >-
          {% if states("sensor.total_power")|float(2)  < 0 %}
            {{((states("sensor.total_power")|float(2))|round(2)*(-1))}}
          {% else %}
            {{(states ('0.0')|float(0))|round(2) }}
          {% endif %}

 - platform: integration
    source: sensor.return_to_grid_calculated
    name: return_to_grid_calculated_kwh
    unit_prefix: k
    round: 2
    method: left
Then I need the utility meters for putting the calculated values (my month starts at 12):
# Netmetering (calculated)
  quarter_hourly_netmetering_energy:
    source: sensor.quarter_hourly_netmetering
    cycle: quarter-hourly
  daily_netmetering_energy:
    source: sensor.quarter_hourly_netmetering
    cycle: daily
  monthly_netmetering_energy:
    source: sensor.quarter_hourly_netmetering
    cycle: monthly
    offset:
      days: 12
  yearly_netmetering_energy:
    source: sensor.quarter_hourly_netmetering
    cycle: yearly
  #
  # Injection (calculated)
  quarter_hourly_injection_energy:
    source: sensor.quarter_hourly_injection
    cycle: quarter-hourly
  daily_injection_energy:
    source: sensor.quarter_hourly_injection
    cycle: daily
  monthly_injection_energy:
    source: sensor.quarter_hourly_injection
    cycle: monthly
    offset:
      days: 12
  yearly_injection_energy:
    source: sensor.quarter_hourly_injection
    cycle: yearly
For calculating values to put on those Utility Meters i used a Nodered flow that calculates the net value and puts it on the sensor feed in the utility meters: sensor.quarter_hourly_netmetering and sensor.quarter_hourly_injection

[{"id":"4a650827d449fd3b","type":"cronplus","z":"7d27859395acc0bf","name":"quarter-hourly","outputField":"payload","timeZone":"","persistDynamic":false,"commandResponseMsgOutput":"output1","outputs":1,"options":[{"name":"schedule1","topic":"quarter-hourly","payloadType":"num","payload":"0","expressionType":"cron","expression":"58 14,29,44,59 * * * * *","location":"","offset":"0","solarType":"all","solarEvents":"sunrise,sunset"}],"x":110,"y":115,"wires":[["9b76811efbdbfc58","ec45781ca3ab7e3b"]]},{"id":"a2a6d28d63fead7e","type":"comment","z":"7d27859395acc0bf","name":"Netmetering","info":"","x":325,"y":80,"wires":[]},{"id":"9b76811efbdbfc58","type":"api-render-template","z":"7d27859395acc0bf","name":"netmetering calculation","server":"14d98a81.8cd3d5","version":0,"template":"{% set totalnow = states('sensor.quarter_hourly_total_energy')|float(0)|round(2) %}\n{% set returnnow = states('sensor.quarter_hourly_return_to_grid')|float(0)|round(2) %}\n\n{% set netmetering_temp = (totalnow|float(0)|round(2))-(returnnow|float(0)|round(2)) %}\n\n{%- if (netmetering_temp|float(0)|round(2)) > 0 %}\n{%- set netmetering = returnnow %}\n{%- else %}\n{%- set netmetering = totalnow %}\n{%- endif %}\n\n{% set before = states('sensor.quarter_hourly_netmetering')|float(0)|round(2) %}\n{% set netmetering = before + netmetering %}\n\n{{ netmetering|float(0)|round(2) }}","resultsLocation":"payload","resultsLocationType":"msg","templateLocation":"","templateLocationType":"none","x":365,"y":115,"wires":[["496e8b1fb765dac0","af67ee410ff2e88b"]]},{"id":"496e8b1fb765dac0","type":"debug","z":"7d27859395acc0bf","name":"netmetering","active":true,"tosidebar":true,"console":false,"tostatus":true,"complete":"payload","targetType":"msg","statusVal":"netmetering","statusType":"auto","x":600,"y":165,"wires":[]},{"id":"af67ee410ff2e88b","type":"ha-sensor","z":"7d27859395acc0bf","name":"Quarter Hourly Netmetering","entityConfig":"75fd01f783ef7adb","version":0,"state":"payload","stateType":"msg","attributes":[],"inputOverride":"allow","outputProperties":[],"x":650,"y":115,"wires":[[]]},{"id":"b79940d566dfca8c","type":"comment","z":"7d27859395acc0bf","name":"Injection","info":"","x":315,"y":170,"wires":[]},{"id":"ec45781ca3ab7e3b","type":"api-render-template","z":"7d27859395acc0bf","name":"injection calculation","server":"14d98a81.8cd3d5","version":0,"template":"{% set totalnow = states('sensor.quarter_hourly_total_energy')|float(0)|round(2) %}\n{% set returnnow = states('sensor.quarter_hourly_return_to_grid')|float(0)|round(2) %}\n\n{% set netmetering_temp = (totalnow|float(0)|round(2))-(returnnow|float(0)|round(2)) %}\n\n{%- if (netmetering_temp|float(0)|round(2)) > 0 %}\n{%- set netmetering = returnnow %}\n{%- else %}\n{%- set netmetering = totalnow %}\n{%- endif %}\n\n{% if (netmetering < returnnow) %}\n{% set injection = (returnnow - netmetering) %}\n{% else %}\n{% set injection = 0 %}\n{% endif %}\n\n{% set before = states('sensor.quarter_hourly_injection')|float(0)|round(2) %}\n{% set injection = before + injection %}\n\n{{ injection|float(0)|round(2) }}","resultsLocation":"payload","resultsLocationType":"msg","templateLocation":"","templateLocationType":"none","x":355,"y":205,"wires":[["da145458a516b149","998feb1daf452241"]]},{"id":"da145458a516b149","type":"debug","z":"7d27859395acc0bf","name":"injection","active":true,"tosidebar":true,"console":false,"tostatus":true,"complete":"payload","targetType":"msg","statusVal":"netmetering","statusType":"auto","x":590,"y":255,"wires":[]},{"id":"998feb1daf452241","type":"ha-sensor","z":"7d27859395acc0bf","name":"Quarter Hourly Injection","entityConfig":"da3d1f926b845a0f","version":0,"state":"payload","stateType":"msg","attributes":[],"inputOverride":"allow","outputProperties":[],"x":640,"y":205,"wires":[[]]},{"id":"14d98a81.8cd3d5","type":"server","name":"Home Assistant","version":5,"addon":true,"rejectUnauthorizedCerts":true,"ha_boolean":"y|yes|true|on|home|open","connectionDelay":true,"cacheJson":true,"heartbeat":false,"heartbeatInterval":"30","areaSelector":"friendlyName","deviceSelector":"friendlyName","entitySelector":"friendlyName","statusSeparator":"at: ","statusYear":"hidden","statusMonth":"short","statusDay":"numeric","statusHourCycle":"h23","statusTimeFormat":"h:m","enableGlobalContextStore":true},{"id":"75fd01f783ef7adb","type":"ha-entity-config","server":"14d98a81.8cd3d5","deviceConfig":"","name":"Quarter Hourly Netmetering","version":"6","entityType":"sensor","haConfig":[{"property":"name","value":"Quarter Hourly Netmetering"},{"property":"icon","value":"mdi:gauge"},{"property":"entity_category","value":""},{"property":"device_class","value":"energy"},{"property":"unit_of_measurement","value":"kWh"},{"property":"state_class","value":"total_increasing"}],"resend":true,"debugEnabled":false},{"id":"da3d1f926b845a0f","type":"ha-entity-config","server":"14d98a81.8cd3d5","deviceConfig":"","name":"Quarter Hourly Injection","version":"6","entityType":"sensor","haConfig":[{"property":"name","value":"Quarter Hourly Injection"},{"property":"icon","value":"mdi:gauge"},{"property":"entity_category","value":""},{"property":"device_class","value":"energy"},{"property":"unit_of_measurement","value":"kWh"},{"property":"state_class","value":"total_increasing"}],"resend":true,"debugEnabled":false}]
I run those “render template nodes” at 2 second before the quarter hour ends with the cronplus node.
The nodered flow code is above but here it is the Netmetering Calculation node, if you want it to put it on HA only:
{% set  totalnow = states('sensor.quarter_hourly_total_energy')|float(0)|round(2)  %}
{% set  returnnow = states('sensor.quarter_hourly_return_to_grid')|float(0)|round(2)  %}

{% set netmetering_temp = (totalnow|float(0)|round(2))-(returnnow|float(0)|round(2)) %}

{%- if (netmetering_temp|float(0)|round(2))  > 0 %}
{%-  set netmetering = returnnow %}
{%- else %}
{%-  set netmetering = totalnow %}
{%- endif %}

{%  set  before = states('sensor.quarter_hourly_netmetering')|float(0)|round(2) %}
{%  set  netmetering = before + netmetering  %}

{{ netmetering|float(0)|round(2) }}
The Injection Calculation node:
{% set  totalnow = states('sensor.quarter_hourly_total_energy')|float(0)|round(2)  %}
{% set  returnnow = states('sensor.quarter_hourly_return_to_grid')|float(0)|round(2)  %}

{% set netmetering_temp = (totalnow|float(0)|round(2))-(returnnow|float(0)|round(2)) %}

{%- if (netmetering_temp|float(0)|round(2))  > 0 %}
{%-  set netmetering = returnnow %}
{%- else %}
{%-  set netmetering = totalnow %}
{%- endif %}

{% if (netmetering < returnnow) %}
{%  set injection = (returnnow - netmetering) %}
{% else %}
{%  set injection = 0 %}
{% endif %}

{%  set before = states('sensor.quarter_hourly_injection')|float(0)|round(2) %}
{%  set injection = before + injection  %}

{{ injection|float(0)|round(2) }}
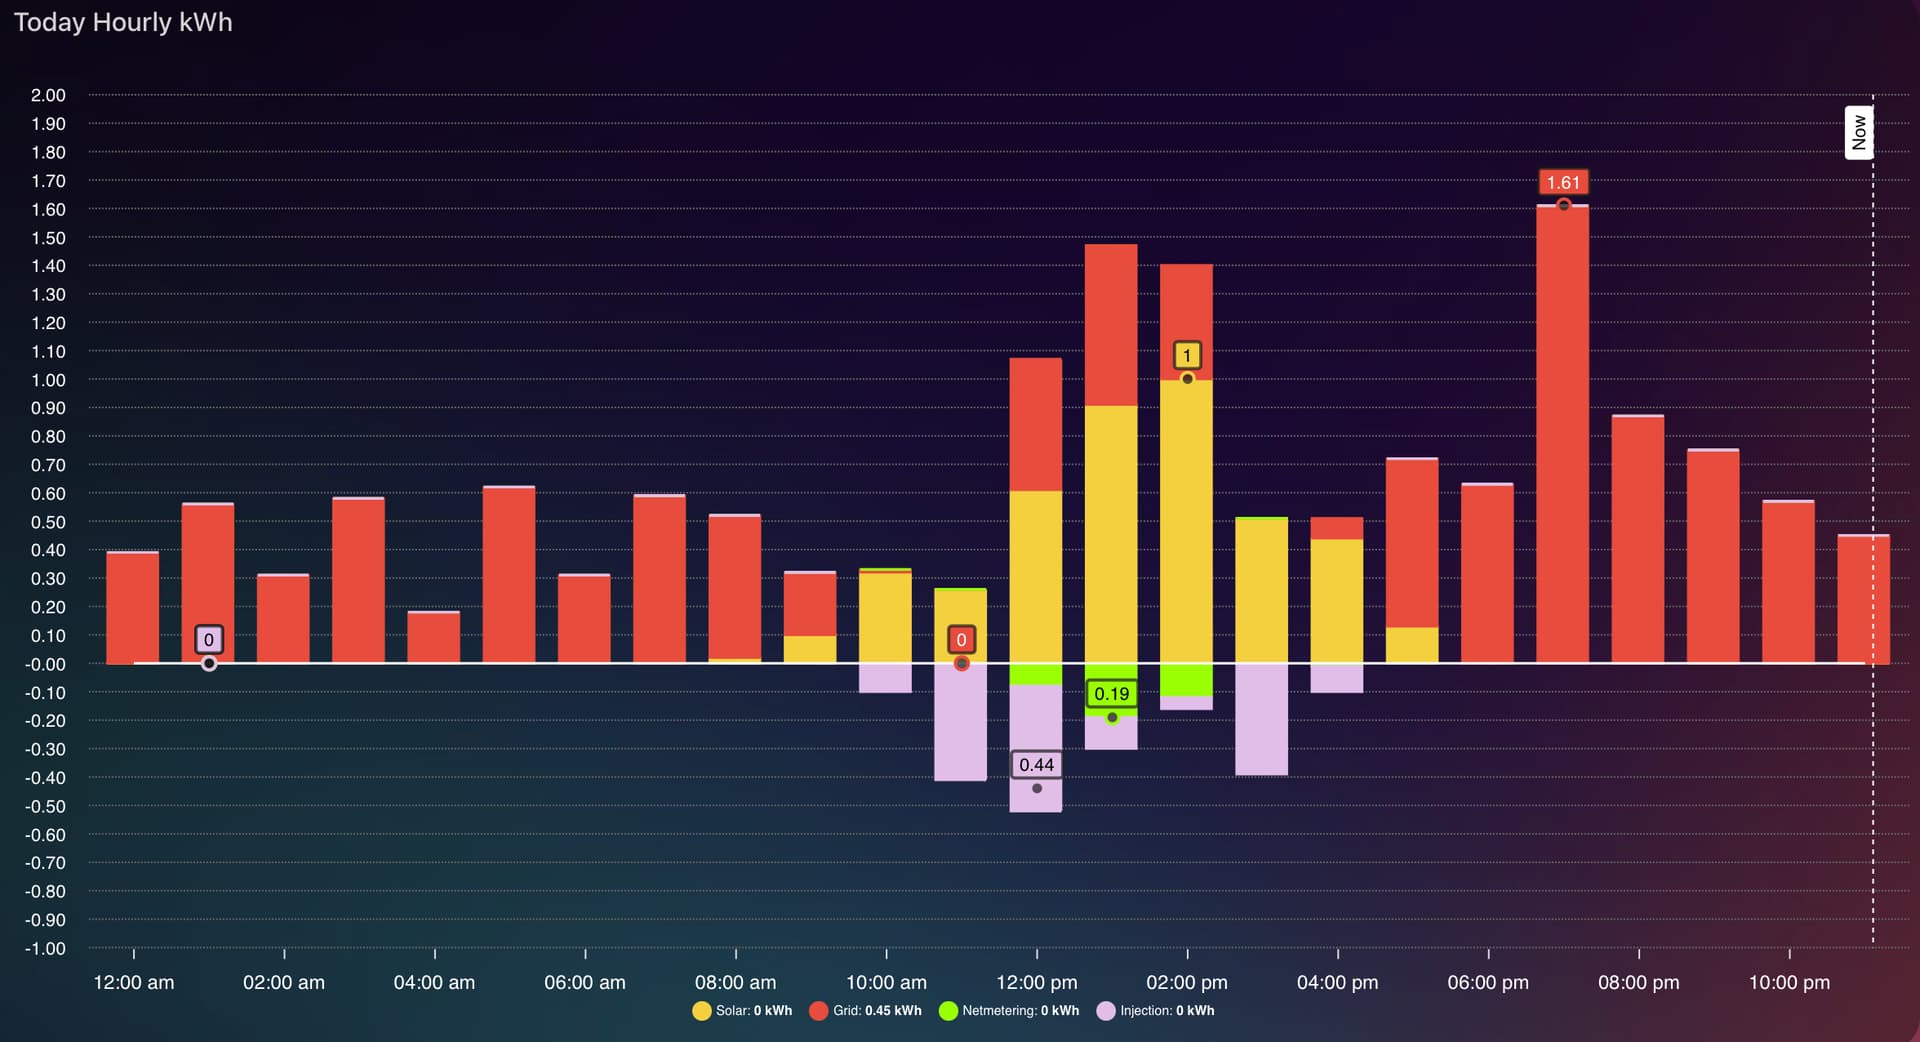
After having the data on the Utility Meters, you can have some nice graphs (i use appexcharts):
This first image is a hourly graph like the one on the energy dashboard of HA but with netmetering and injection separated with colors (green and purple).
Code:
type: custom:apexcharts-card
graph_span: 24h
span:
  end: day
  offset: +0h
header:
  show: true
  title: Today Hourly kWh
yaxis:
  - decimals: 2
    apex_config:
      tickAmount: 30
    max: 2
    min: -1
apex_config:
  dataLabels:
    enabled: true
    formatter: |
      EVAL:function(value) {
        if (value <= 0.2){
          value = ''
        }
        return value;
      }
  annotations:
    position: front
    yaxis:
      - 'y': 0
        strokeDashArray: 0
        borderColor: '#FFFFFF'
        borderWidth: 1.5
  chart:
    height: 600
  stroke:
    width: 1.5
  grid:
    show: true
    borderColor: '#666666'
    strokeDashArray: 1
  xaxis:
    lines:
      show: true
    axisBorder:
      show: false
    labels:
      style:
        fontSize: 12px
  yaxis:
    axisBorder:
      show: false
  legend:
    show: true
    fontSize: 8px
    labels:
      style:
        fontSize: 5px
all_series_config:
  extend_to: now
  float_precision: 2
stacked: true
now:
  show: true
  color: '#FFFFFF'
  label: Now
series:
  - entity: sensor.daily_solar_used
    type: column
    name: Solar
    color: '#F4D03F'
    show:
      datalabels: false
      extremas: true
    group_by:
      func: delta
      duration: 1h
  - entity: sensor.daily_total_energy
    type: column
    name: Grid
    color: '#E74C3C'
    show:
      datalabels: false
      extremas: true
    group_by:
      func: delta
      duration: 1h
  - entity: sensor.quarter_hourly_netmetering_energy
    type: column
    name: Netmetering
    color: '#99FF00'
    show:
      datalabels: false
      extremas: true
    invert: true
    group_by:
      func: sum
      duration: 1h
  - entity: sensor.quarter_hourly_injection_energy
    type: column
    name: Injection
    color: '#E1BEE7'
    show:
      datalabels: false
      extremas: true
    invert: true
    group_by:
      func: sum
      duration: 1h
The second one is a quarter-hourly graph of mainly the netmetering and injection but with shaded solar used and grid used.
Code:
type: custom:apexcharts-card
graph_span: 12h
span:
  start: day
  offset: +7h
header:
  show: true
  title: Netmetering/Injection Quarterly-Hour kWh
yaxis:
  - decimals: 2
    apex_config:
      tickAmount: 5
    max: 0.5
    min: 0
apex_config:
  dataLabels:
    enabled: true
    formatter: |
      EVAL:function(value) {
        if (value <= 0.2){
          value = ''
        }
        return value;
      }
  annotations:
    position: front
    yaxis:
      - 'y': 0
        strokeDashArray: 0
        borderColor: '#FFFFFF'
        borderWidth: 1.5
  chart:
    height: 300
  stroke:
    width: 0
  grid:
    show: true
    borderColor: '#666666'
    strokeDashArray: 1
  xaxis:
    lines:
      show: true
    axisBorder:
      show: false
    labels:
      style:
        fontSize: 12px
  yaxis:
    axisBorder:
      show: false
  legend:
    show: true
    fontSize: 8px
    labels:
      style:
        fontSize: 5px
all_series_config:
  extend_to: now
  float_precision: 2
stacked: true
now:
  show: true
  color: '#FFFFFF'
  label: Now
series:
  - entity: sensor.quarter_hourly_netmetering_energy
    type: column
    name: Netmetering 15min
    color: '#99FF00'
    show:
      datalabels: false
      extremas: false
    group_by:
      func: max
      duration: 15min
  - entity: sensor.quarter_hourly_injection_energy
    type: column
    name: Injection 15min
    color: '#E1BEE7'
    show:
      datalabels: false
      extremas: false
    group_by:
      func: max
      duration: 15min
  - entity: sensor.quarter_hourly_solar_used_energy
    type: column
    name: Solar Used 15 min
    color: '#F4D03F'
    opacity: 0.2
    group_by:
      func: max
      duration: 15min
  - entity: sensor.quarter_hourly_total_energy
    type: column
    name: Grid 15 min
    color: '#E74C3C'
    opacity: 0.2
    group_by:
      func: max
      duration: 15min
Enjoy.
Pedro.
