Hi, I’ve a question about Netatmo integration in Grafana. Netatmo and Grafana installation did not cause any troubles. All seems to work well but my Grafana graphs showing wierdly missing data points in the graphs.
The missing data points do not correlate with other Netatmo graphs.
It seems to me, that the data acquisition for netatmo sensors is somehow broken, since the data displayed within Home-Assistant is showing similar missing data points.
Does anyboda have an idea how to tackle this problem? Any help is very much appreciated.
Cheers, Andiroid
As far as I can tell for Grafana it is the plot type that you chose (single datapoints instead of line). The Home Assistant graphs show no signs of the sensor going unavailable. The graph is normal for when the temperature is constant for some time. Home Assistant will not save those datapoints to conserve database size.
Or your Netatmo having bad communication? It isn’t reporting unavailable but it is also not getting new data. After the 1 degree drop it does drop further. It could also be the cold wind turning towards the sensor.
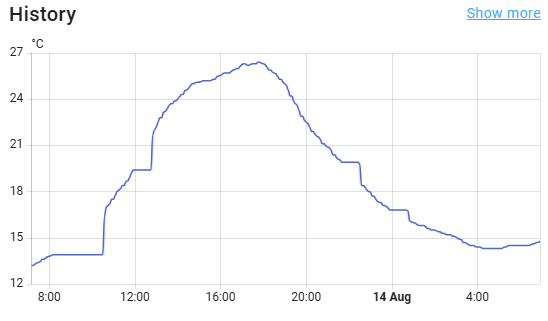
I have this exact kind of situation going on with Netatmo for some time. In the Netatmo dashboard at their servers, it seems everything is fine, but Home Assistant keeps doing these gaps:
I have 3 Netatmo weather stations in 3 different locations and all of them have this bug.
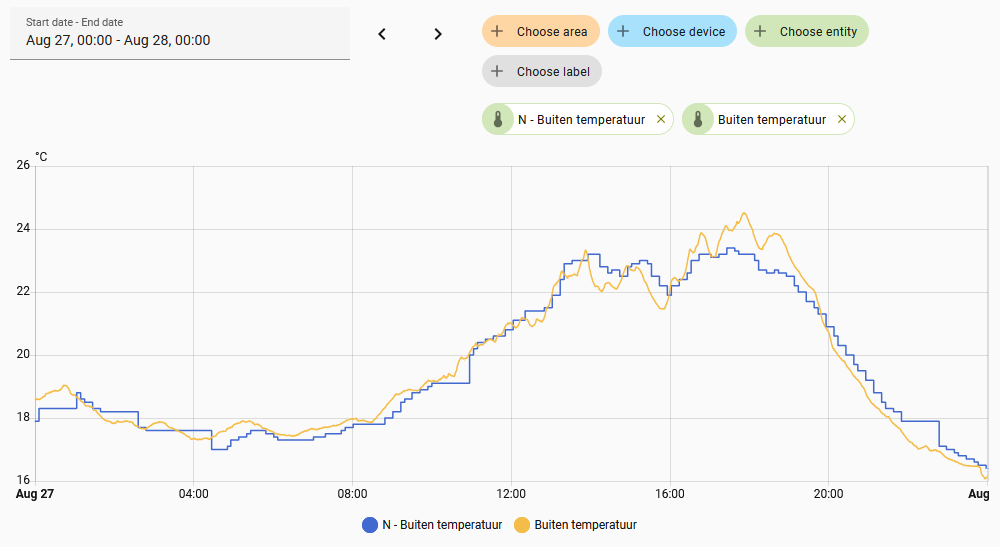
The station that runs on my local network is also connected to home assistant in local via HomeKit and provides reliable reporting with NO bug.
As you can see on the graph below, the local sensor has no gap but the sensor coming from Netatmo cloud has sometimes gap and forget measurement.
So it seems that the problem come from Netatmo integration or Netatmo cloud servers that sometimes -but frequently- misses updating data.
I would say it happens approx 2-3 times a day.
I experience the same problem, and in the logs, I can see that the server receives too many requests!
Netatmo limits the number of requests per hour; it seems that the integration does not know that
An issue was opened on github, but nobody worked on it, and it now closed:
I am seeing the same, but I am not convinced that this is due to being blocked because of accessing the Netatmo service too often.
It could very well be a connection problem as well, either due to the internet connection being unreliable, or due to the Netatmo servers temporarily being unresponsive somehow.
When the local Netatmo device cannot access the Netatmo servers for any reason, the data is still stored locally for an extended period.
I think this can be for several hours, but am not sure about the maximum capacity.
But as soon as the connection is back, this stored data is sent to the Netatmo server.
So in the end the data in the Netatmo web interface is always complete.
But the Home Assistant data unfortunately only is based on the “real time” data as received from the Netatmo API every five minutes.
Hence the difference in the two graphs.
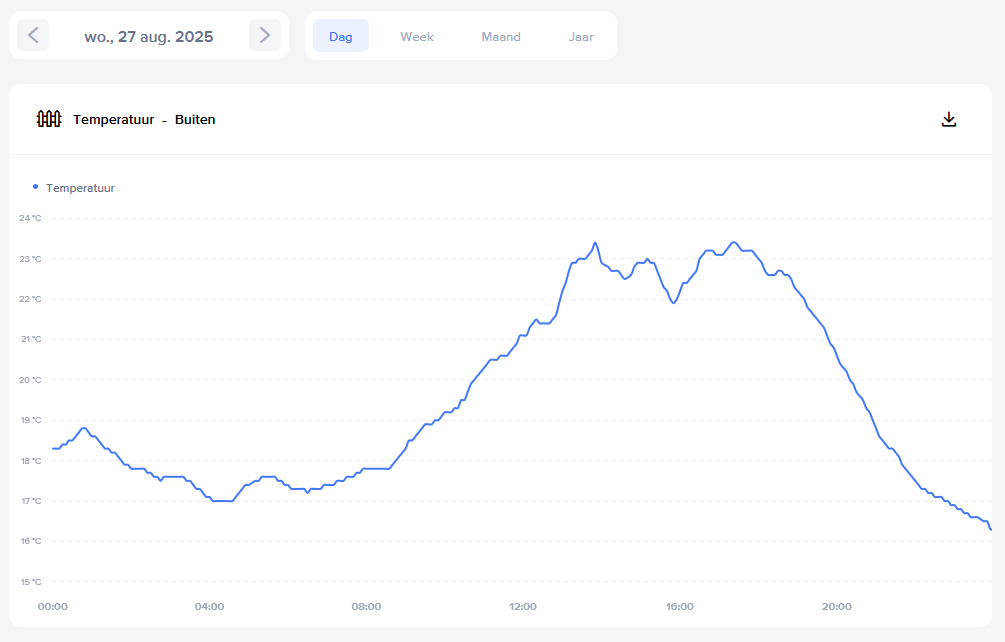
This is my outside temperature shown in the Netatmo web interface for yesterday:
It would be nice if the Home Assistant Netatmo integration would be able to collect historical data as well, so that the history graphs could be updated afterwards, filling gaps of missing data when these come available again.
This historical data is available for download from the Netatmo servers in CSV format, so in theory this should be possible I think, but I am afraid that the current possiblities in Home Assistant do not support this.