I know the Z-Wave JS node/network graph was never displaying the true routes, but it was useful to see a list of neighbour’s for nodes, but it seems completely changed now and not as useful, ie no neighbours, idea of hops etc? Or am I missing something obvious?
zwave-js-ui: 8.17.1
zwave-js: 10.22.2
Z-Wave JS UI Current version: 1.13.2
Yes, the graph new properly displays the connections between the nodes based on the reported route statistics. You will need to generate some traffic to get new route data, it’s not yet read from the controller. However, if you have an older controller you may not get any route information at all.
The old graph was next to useless. Neighbors don’t tell you anything useful, and it was often just plain incorrect.
What’s the definition of an older controller (literally timespan)? Mine is zwave plus zwave.me UZB1.
Is there a list of controllers that support this statistics feature (I thought all controllers were the same tbh and supported a standard feature set), or a specific feature listed on a manufacturer website we need to look for?
So this new map will tell us the routes used?
Is there any way to switch back to the old network diagram?
What happened to Advanced menu on the whole network level? Previosly it was possible to one-click reinterview or heal whole network, now this option seems to be available only on individual nodes level… or am I missing something?
BTW I also see another change; there is compact view that shows nodes as tiles instead of table… I think this is new as well…
I don’t know for sure, but I am guessing anything on SDK 6.8X should work. For example, upgrading an Aeotec Gen5 from 1.0/1.1 to 1.2 should add support.
A future version of ZUI/Z-Wave JS might be able to read the routing information from the controller (possibly supporting these older ones), but there won’t be automatic updates.
There’s no list that I know of. If I had to guess, probably everything except the Nortek and Aeotec Gen5 < 1.2. The Z-Wave.me product page says the UZB1 supports statistics, so you might want to confirm with their tech support how that is supported. Maybe you need a firmware update. The controllers are not all the same, functionality will depend on which Z-Wave SDK they are using, and if the vendor has installed custom firmware, e.g. Z-Wave.me and Aeotec Gen5 use custom firmware. Most of the Gen 7 sticks are basically the same, but again Z-Wave.me is an exception.
Yes, the driver emits route information for each Z-Wave message and the graph will update to reflect the latest data. The graph should show live updates.
No
Click the big blue plus (+) button, then Advanced actions.
I managed to upgrade from SDK 6.51.09 to 6.71.01 so far, there are other upgrades to still do but I am hitting issues so will follow up with Z-Wave.me support.
It’s also my understanding the routing info is only updated when the controller sends commands to nodes (part of the message ACK). For battery devices, you may not see any data until either the device wakes up, or you manually wake it up, or it uses Supervision, which all require the controller to send commands. I have a few battery devices that never wake up, and don’t support Supervisions, so while they are reporting states (e.g. door open), routing data is not provided.
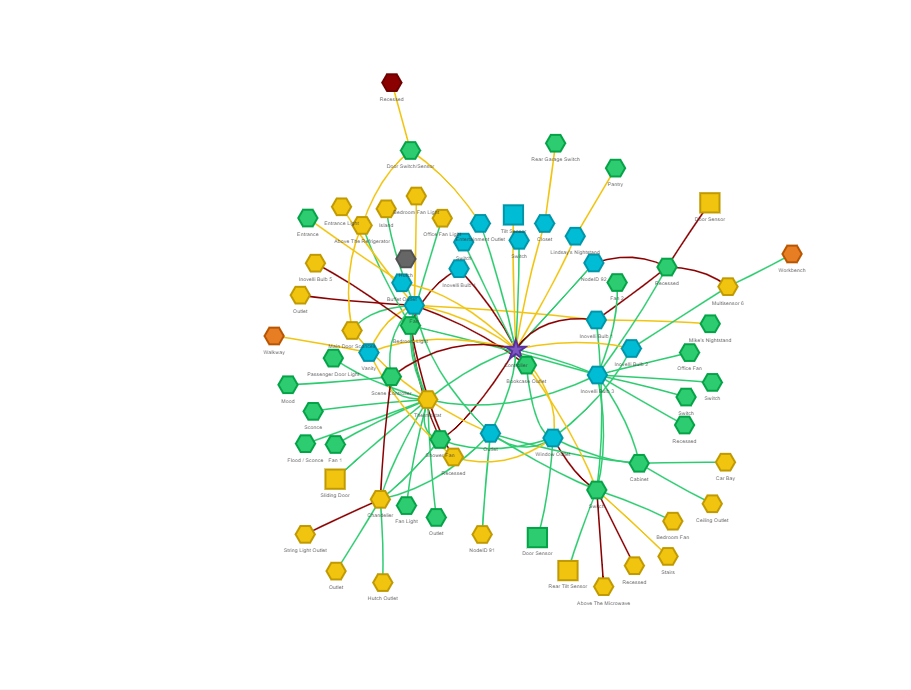
After few days (and perhaps some data collection… or the latest update of Zwave JS done just today) I can confirm that graph is generated for old Aeotec Z-stick Gen 5 with FW 1.01. here is sample:
So as I guess from the chart sqares are battery powered devices, gexagons are mains powered, star is controller. cyans are first hop, greens are two hops away from controller and yellows are 3 hops… grayed are not (yet properly) discovered devices.
To be honest some of these routes do not make a lot of sense to me, as are far from optimal, considering distances and required wall penetration. How these are selected?
The Last Working Route (LWR) is queried on startup with the latest Z-Wave JS/Z-Wave JS UI, so I am guessing that’s what happened here, but you can check if you are getting live updates by inspecting the driver debug logs and looking for command ACKs. For example:
But here is the thing: Device “42 Not Used” has not been used in 6 months and has no battery in it, so cannot talk to my network. Yet it went from grey to green (left side of picture), showing it is connected to pool controller. But that is impossible. It has no battery so cannot talk. So how did that happen?
ZUI queries the controller for all the nodes’ last working route. So even though the node has not been used for some time, it still has information about previous routes.
@freshcoast , thanks. That makes sense as when I last use the ‘Not Used’ device 6 months ago, it was near the pool controller, which is what the graph does show. VERY cool graph function. Were you involved in updating this? If so, you really nailed it.
Just from my observations, another reason you can have missing route links in the “zoomed out” view is if the controller reported a next last working route (NLWR) instead of the LWR. It appears the NLWR are not rendered on the zoomed out view (dashed edges), but only when selecting the node.