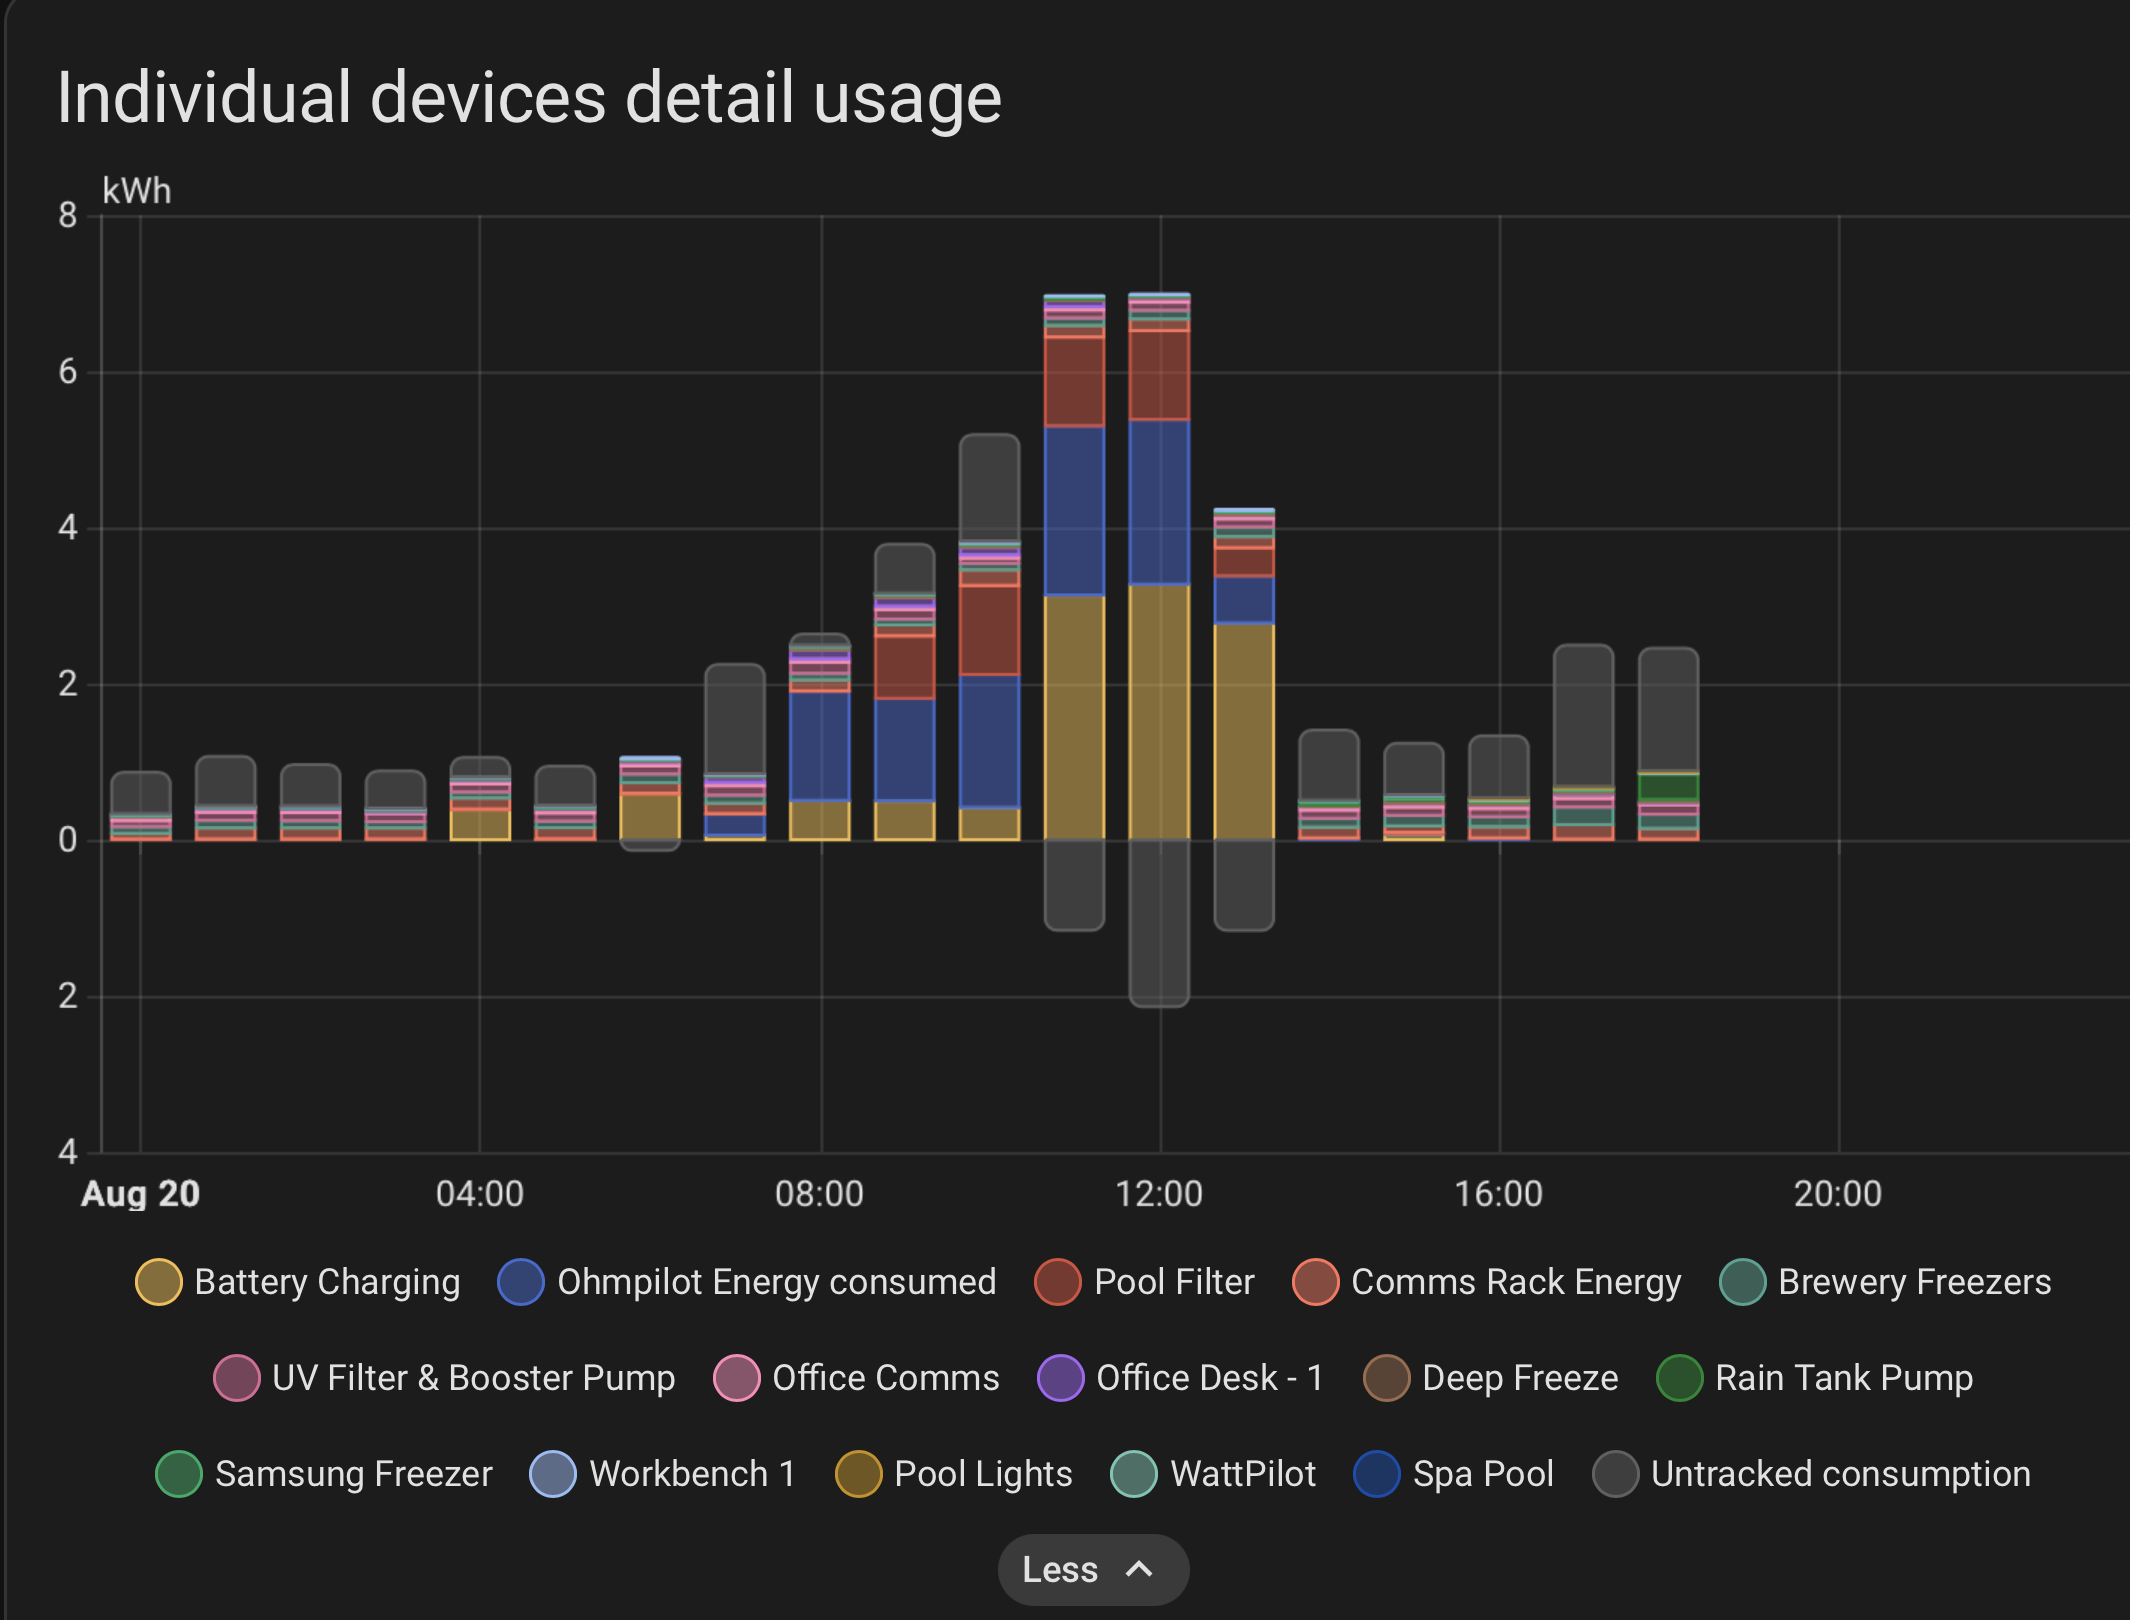
Is this a bug? or am I reading the graphs wrong? One thing that does strike me is that during the middle of the day I have -ve untracked consumption… How does that work?
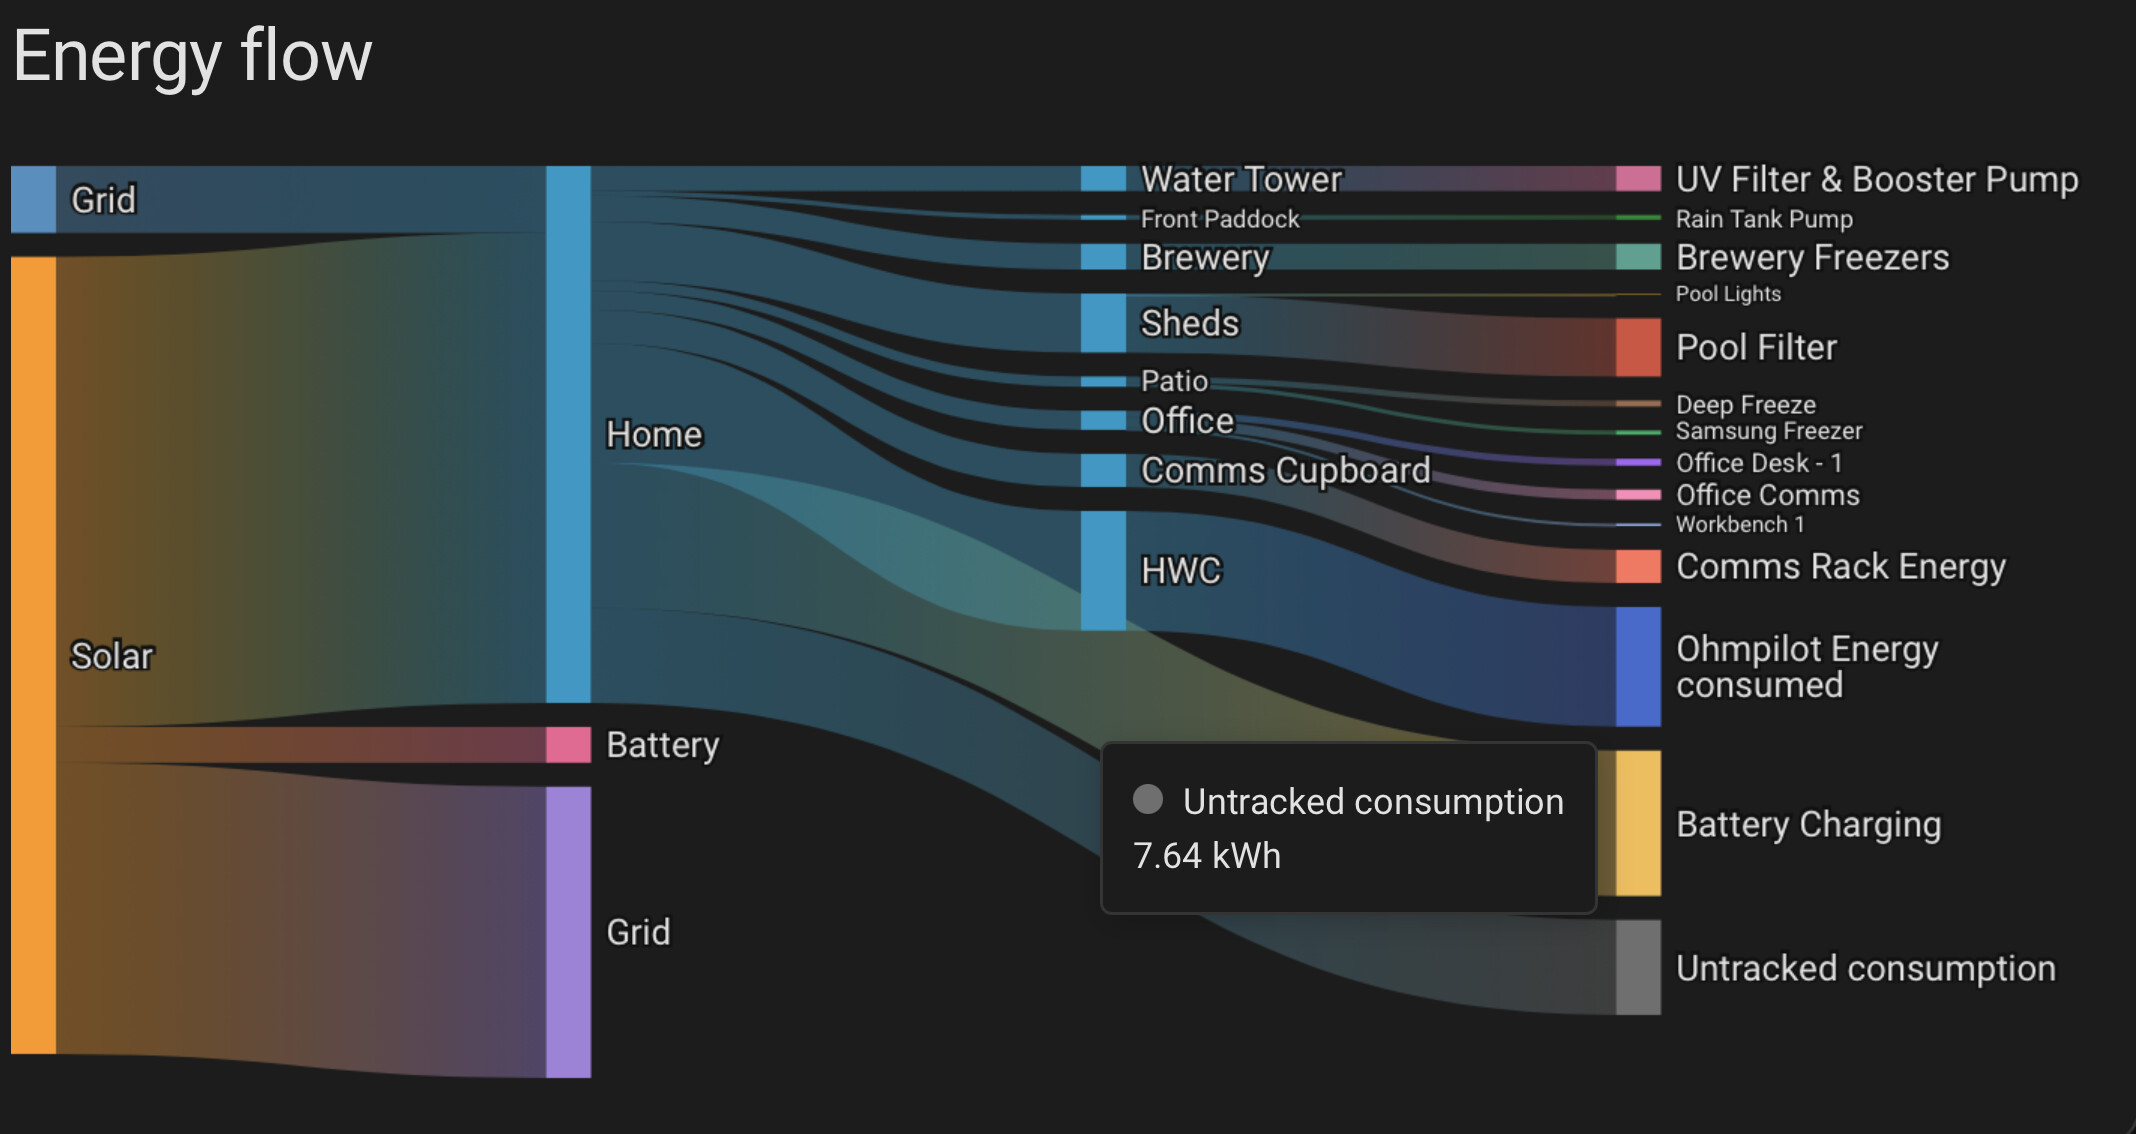
The untracked on ‘daily’ level is incorrect with me too (similarly too low in the flow graph), on a weekly level it is spot-on. You should check the issues on github if there is already a case, else open one.
Sounds like you’re making a very rough estimate. Download the CSV table, and sum up all the untracked for each hour. My guess is it will be exact.
during the middle of the day I have -ve untracked consumption… How does that work?
Untracked = Energy In - Device consumed
If your devices report consuming more energy than you recorded coming into the home, untracked will be negative. Usually this is an indication you are maybe double counting something, or one of your grid source or devices is not accurate.
It is not a rough estimate, when adding figures per-hour one ends up with a total which is clearly higher (edited) than what the flow thing shows. For weekly views it is spot-on and I did not test further myself, Guesswork for the daily calc is that it may have a time issue when filtering, individual ones seem to be ok. As I asked the OP, likely it requires a detailed issue.