Each configured gauge creates a device with up to 4 entities:
Entity
Unit
Notes
Gauge Height
ft
Water level above the gauge datum
Discharge
ft³/s
Volumetric flow rate (CFS)
Water Temperature
°C
Not available at all gauges
Station Status
—
Active or Offline
The Station Status entity stays active even when the gauge is offline for the season, and includes an offline_reason attribute explaining why.
Measurement sensors for parameters a gauge never reports (e.g., Water Temperature at a gauge with no thermistor) will show as Unavailable after the first successful data fetch.
Thanks for this, I just started pulling the same four USGS params for a Catawba-Wateree (NC) project and should have known to search here first.
It seems like the legacy waterservices.usgs.gov NWIS endpoints are on the way out and USGS is steering everyone to the modernized api.waterdata.usgs.gov OGC API (daily / instantaneous collections). I migrated my puller over recently and it's returning identical numbers to the old endpoint so far. If you want to future-proof this against the decommission I am happy to share exactly what the new request shapes look like.
On top of raw discharge I compute % of long-term average + a short trend and map it to a normalized "stage" so the same number reads as drought / low-flow at the bottom and flood / high-flow at the top, on any gauge. I drive some local water-restriction automations off it in Charlotte (currently stage 2 - residential watering based on odd/even address, no running ornamental water features that dont support aquatic life, etc), but the classification math itself is gauge-agnostic. Would a stats/classification layer that sits on top of (or beside) your sensors be something you would want folded in or would you rather keep this one lean and let it be a separate companion? I would much rather collaborate than fork.
I am in no way an expert in this, just a pet project since I have control of my home sprinkler system. I was halfway expecting to see landscapers, building owners, etc to also be tying into these public reports... I wonder how they do it.
Hi, thanks very much for reaching out and the comments, especially around decommissioning of the old API (looks like its good through 1Q27, so I'll have a look and convert over when I have some time).
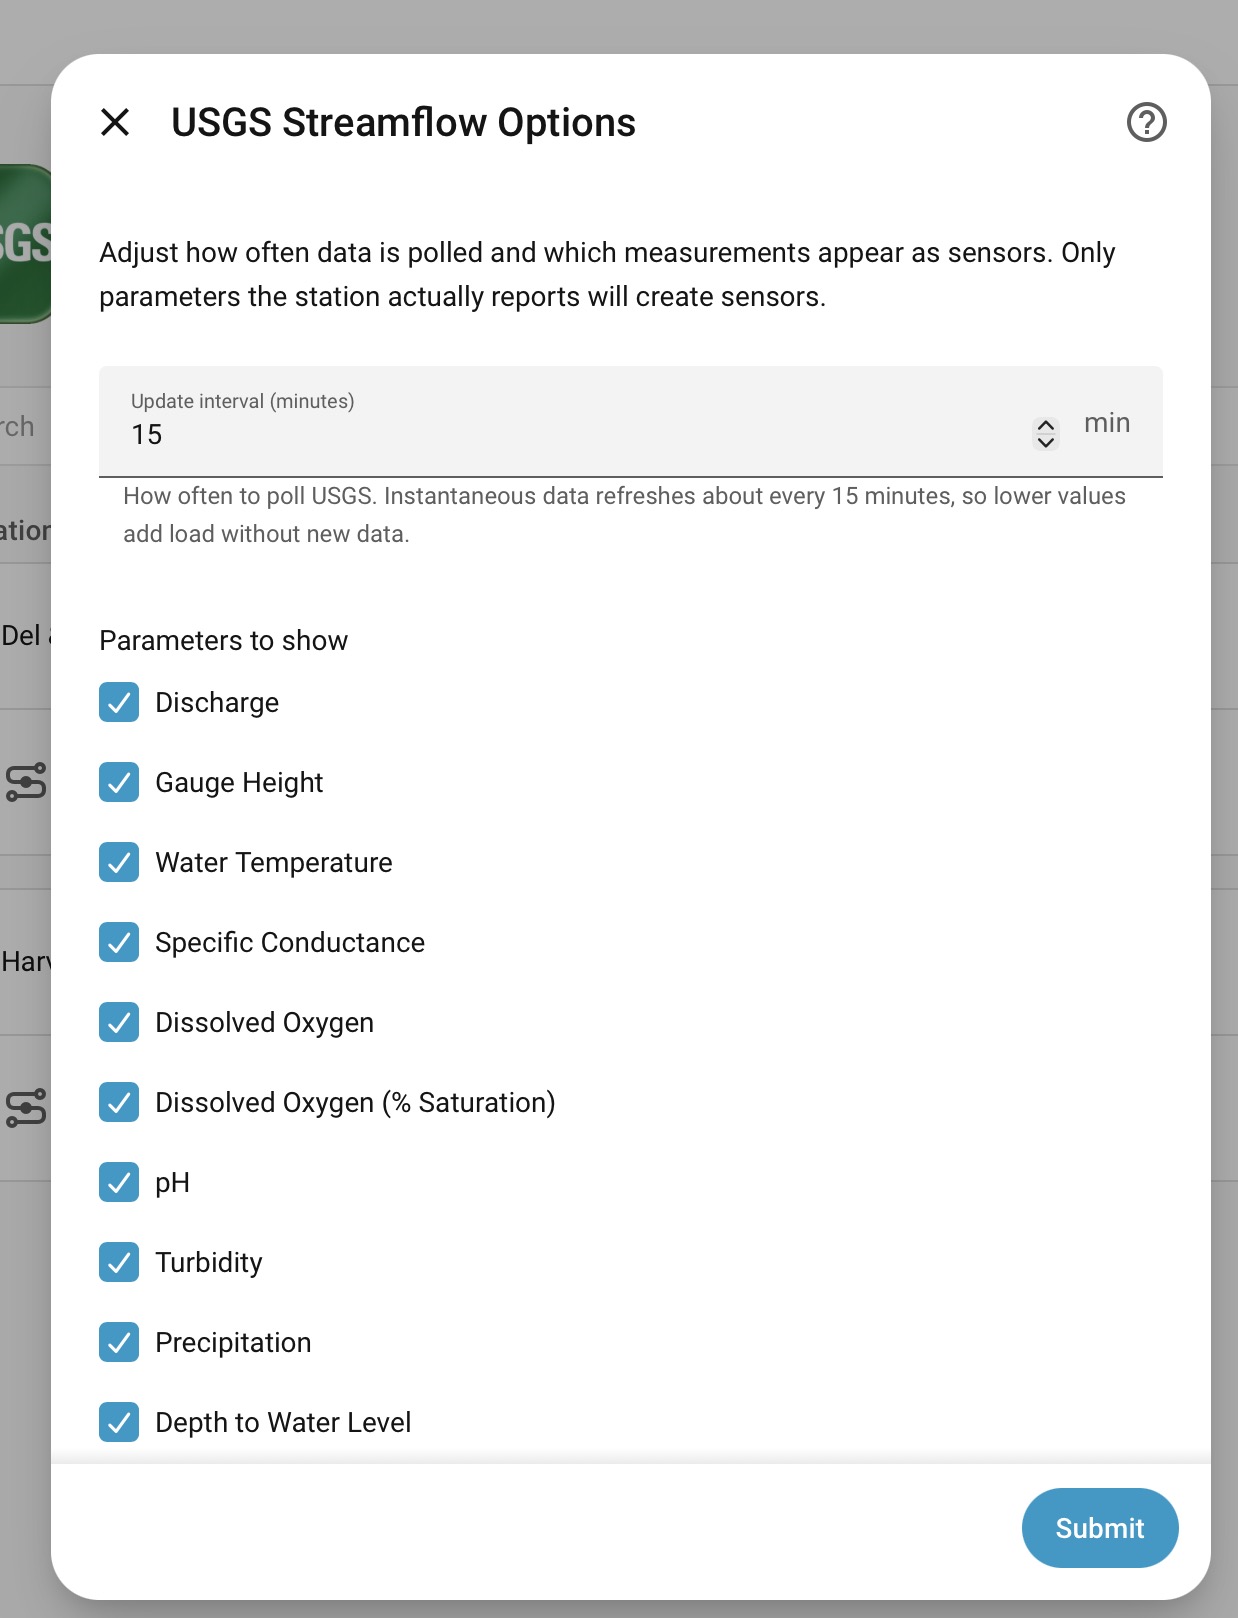
Tonight I added some functionality in a beta release on HACS (1.1.0b1), including allowing changing the polling interval (minimum of 15 minutes) and it should now pull in every sensor for a specific station, unless you choose not to bring them in. I don't use them for my usage, but they're interesting if someone wants (like water ph, water temp, turbidity).
I now see that USGS provides below ground types (sewer, ground water) that I can incorporate, but they're 15 digit codes, so I'll need to modify some code to incorporate.
For automations/tracking of stats and trends, I didn't want to overly complicate the code, since Home Assistant handles stats very well, I thought it would be best to allow users to setup whatever they want from the raw data. Would be interested in seeing how you're doing it, I'm also in a drought restricted region (Colorado).
Updated the code this weekend to add new features, including "trends" in flow rates and gauge depths, as well as moving over to the new modern API, as the legacy system will be decommissioned in 1Q27.