Hi all,
I’ve been hitting my head against the wall with this for at least a week so I’m turning to the experts.
My ISP recently broke the integration I used to track usage against my monthly data cap. To combat this, I’ve setup 3 command line sensors that run ssh commands against my pfSense firewall to collect monthly and daily usage via vnstat. The command is formatted to export the values in Bytes, then convert to Gigabytes using a value_template formula.
- Sensor 1 (datacap_mtd_gb) collects the value every hour to give me a running total in GB of how much data I’ve used for the month.
- Sensor 2 (datacap_mtd_percent) is basically identical to sensor 1, but then divides the number by my ISP data cap to give me the utilization in %.
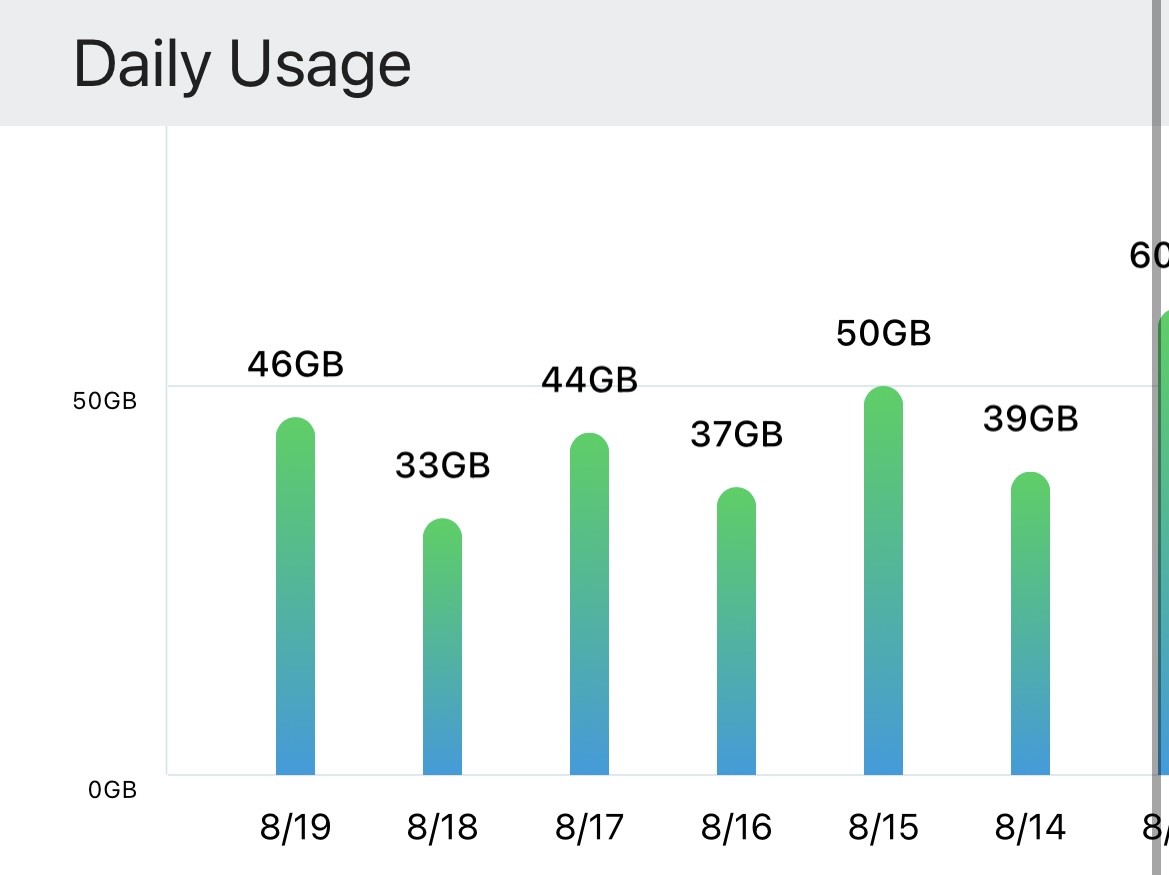
- Sensor 3 (datacap_daily_gb) collects the daily value. This sensor is configured with a scan_interval of 2 weeks, but is updated daily at 11:55PM via an automation task. The goal of this sensor is to collect the daily data usage once every day so I can use a statistics graph to display the daily usage for the last 14 days in bar form.
Each of the sensors work flawlessly; data is collected and I can see the updates when I view the entities in the history view. However, when I go to select the entity of sensor 3 (daily usage) as the source for a statistics graph card, the entity does not appear as an option. If I manually add the entity in the card’s text editor, the graph just doesn’t display anything at all (and I mean nothing, not just that the data is missing, the card is 100% blank). For reference, below is a picture of what I’m trying to emulate on my dashboard:
Troubleshooting steps taken so far:
- Using the template sensor in more variants than I can remember, to no avail.
- Using the customize functions to modify the device_class and/or state_class (in each iteration/combination I can think of) to “measurement”, to no avail.
- Someone on Discord mentioned I should try installing InfluxDB and Grafana, so I did, with no include or exclude parameters. I can confirm that the configuration is correct because all my entities are being recorded in Influx EXCEPT my command_line sensors.
I’m starting to think that either this is a configuration issue in my sensor or that this is simply a limitation of command_line sensors. Copied below are the configurations of each of the three sensors. Please note that this is the contents of my broken out sensor.yaml file which is why the “sensor:” heading is missing.
# Monthly ISP Data Cap. Usage (GB) from pfSense
- platform: command_line
  name: "Data Cap. Usage GB MtD"
  unique_id: datacap_mtd_gb
  scan_interval: 3600
  command: >-
    ssh -o UserKnownHostsFile=/config/dzresources/ssh_hosts [email protected] -i /config/dzresources/pfha_id_rsa 'vnstat -i wan1 --oneline b' | cut -d';' -f 11
  unit_of_measurement: "GB"
  # Convert from B to GB
  value_template: '{{ value | multiply(0.000000001) | round(2) }}'

# Monthly ISP Data Cap. Usage (%) from pfSense
- platform: command_line
  name: "Data Cap. Usage % MtD"
  unique_id: datacap_mtd_percent
  scan_interval: 3600
  command: >-
    ssh -o UserKnownHostsFile=/config/dzresources/ssh_hosts [email protected] -i /config/dzresources/pfha_id_rsa 'vnstat -i wan1 --oneline b' | cut -d';' -f 11
  unit_of_measurement: "%"
  # Convert from B to GB, then convert to % of data cap (1250GB)
  value_template: '{{ (value | multiply(0.000000001)/1250*100) | round(1) }}'

# Daily ISP Data Usage from pfSense, collected at 11:55PM each day via automation task
- platform: command_line
  name: "Data Usage GB Daily"
  unique_id: datacap_daily_gb
  # Refresh rate: 2 weeks, updated every day at 11:55PM via automation task
  scan_interval: 1209600
  command: >-
    ssh -o UserKnownHostsFile=/config/dzresources/ssh_hosts [email protected] -i /config/dzresources/pfha_id_rsa 'vnstat -i wan1 --oneline b' | cut -d';' -f 6
  unit_of_measurement: "GB"
  # Convert from B to GB
  value_template: '{{ value | multiply(0.000000001) | round(2) }}'
Note on the SSH command: the vnstat command outputs a string of values related to the data you’ve requested, separated by semicolons (";"). The section at the end of the commands listed above cuts the string into individual values, then selects the value I’m interested in (monthly totals are value 11, daily totals are value 6).
I would prefer to avoid MQTT (if possible) as well as changes on my firewall itself (after all, HA is able to collect the data just fine), but otherwise I’m open to trying just about anything at this point. I’m happy to provide additional information regarding the setup upon request. Any and all assistance is greatly appreciated! Thanks in advance!