Nuc System Monitoring Card

Ok got it working, code works exactly as it is in op

All you need is: custom:config-template-card

Problem I had is that I had variables and entities under custom:config-template-card that didn’t exist which causes the card to just be blank

Hopefully this post makes it helpful for others to get this working

1 Like

Thxs for the input :smiley: this is the result.

HACS - Frontend

  • hui-entities-card
  • hui-vertical-stack-card
  • button-card
  • mini-graph-card
  • bar-card

Code

type: 'custom:hui-entities-card'
title: 'Gigabite Brix OS: Ubuntu 20.04.1 LTS'
show_header_toggle: 'off'
style: |
  ha-card { border-radius: 20px; }
entities:
  - type: 'custom:hui-vertical-stack-card'
    cards:
      - type: horizontal-stack
        cards:
          - type: picture
            style: |
              ha-card { 
                  --paper-card-background-color: 'rgba(0, 0, 0, 0.0)';
                  --ha-card-background: "rgba(0, 0, 0, 0.0)";
                  --ha-card-box-shadow: 'none';
              }
            image: /local/brixx.png
          - type: 'custom:button-card'
            layout: icon_name_state2nd
            show_icon: true
            show_state: true
            styles:
              grid:
                - grid-template-columns: 50px auto
              icon:
                - padding: 20px 10px
                - height: 30px
                - width: 30px
              card:
                - '--ha-card-background': 'rgba(0, 0, 0, 0.0)'
                - '--ha-card-box-shadow': none
              state:
                - padding: 0px 10px
                - justify-self: start
                - font-family: 'Roboto, sans-serif'
                - font-size: 15px
              name:
                - padding: 0px 10px
                - justify-self: start
                - color: var(--secondary-text-color)
            entity: sensor.cpu_temperatuur
            name: CPU Temperature
            icon: 'mdi:fire'
      - type: 'custom:mini-graph-card'
        entities:
          - entity: sensor.cpu_speed
        name: CPU Usege
        height: 50
        line_width: 2
        font_size: 80
        hours_to_show: 4
        points_per_hour: 90
        show:
          icon: false
          extrema: true
        color_thresholds:
          - value: 28
            color: '#e74c3c'
          - value: 15
            color: '#1db954'
          - value: 0
            color: '#3498db'
        style: |
          ha-card { 
              --paper-card-background-color: 'rgba(0, 0, 0, 0.0)';
              --ha-card-background: "rgba(0, 0, 0, 0.0)";
              --ha-card-box-shadow: 'none';
          }
      - type: 'custom:bar-card'
        title_position: inside
        name: 'Disk usage: 120Gb'
        show_icon: true
        align: split
        columns: 1
        max: 100
        unit_of_measurement: '%'
        severity:
          - value: 50
            color: '#3498db'
          - value: 75
            color: '#f39c12'
          - value: 100
            color: '#e45e65'
        style: |
          ha-card { 
            --paper-card-background-color: 'rgba(0, 0, 0, 0.0)';
            --ha-card-background: "rgba(0, 0, 0, 0.0)";
            --ha-card-box-shadow: 'none';
          }
        entity: sensor.disk_use_percent_home
      - type: horizontal-stack
        cards:
          - type: 'custom:bar-card'
            title_position: inside
            show_icon: true
            align: split
            columns: 1
            max: 100
            unit_of_measurement: '%'
            severity:
              - value: 50
                color: '#3498db'
              - value: 75
                color: '#f39c12'
              - value: 100
                color: '#e45e65'
            style: |
              ha-card { 
                --paper-card-background-color: 'rgba(0, 0, 0, 0.0)';
                --ha-card-background: "rgba(0, 0, 0, 0.0)";
                --ha-card-box-shadow: 'none';
              }
            entity: sensor.memory_use_percent
            name: RAM usage
          - type: 'custom:bar-card'
            title_position: inside
            show_icon: true
            align: split
            columns: 1
            max: 100
            unit_of_measurement: '%'
            severity:
              - value: 50
                color: '#3498db'
              - value: 75
                color: '#f39c12'
              - value: 100
                color: '#e45e65'
            style: |
              ha-card { 
                --paper-card-background-color: 'rgba(0, 0, 0, 0.0)';
                --ha-card-background: "rgba(0, 0, 0, 0.0)";
                --ha-card-box-shadow: 'none';
              }
            entity: sensor.processor_use
            name: CPU usage
      - type: 'custom:mini-graph-card'
        height: 20
        line_width: 2
        font_size: 70
        hours_to_show: 168
        points_per_hour: 1
        show:
          extrema: true
          fill: true
        style: |
          ha-card { 
            --ha-card-background: "rgba(0, 0, 0, 0.0)";
            --ha-card-box-shadow: 'none';
            border-radius: 5px;
          }
        entities:
          - sensor.cpu_temperature
        name: Temperature
        color_thresholds:
          - value: 90
            color: '#3498db'
          - value: 120
            color: '#f39c12'
          - value: 150
            color: '#E45E65'
      - entities:
          - entity: sensor.tijd_online
            name: HA Docker herstart
          - entity: sensor.versie
            name: Home Assisten version
          - entity: sensor.last_boot
            name: System herstart
        show_header_toggle: false
        type: entities
        style: |
          ha-card { 
              --paper-card-background-color: 'rgba(0, 0, 0, 0.0)';
              --ha-card-background: "rgba(0, 0, 0, 0.0)";
              --ha-card-box-shadow: 'none';
          }

3 Likes

I’m getting an error “no card type found”

Do you have the custom cards installed?

Can’t seem to figure out how to add them.

As an update I’ve done a lot of playing with this and got every function to work properly as intended originally and think it looks pretty good so sharing what I have.

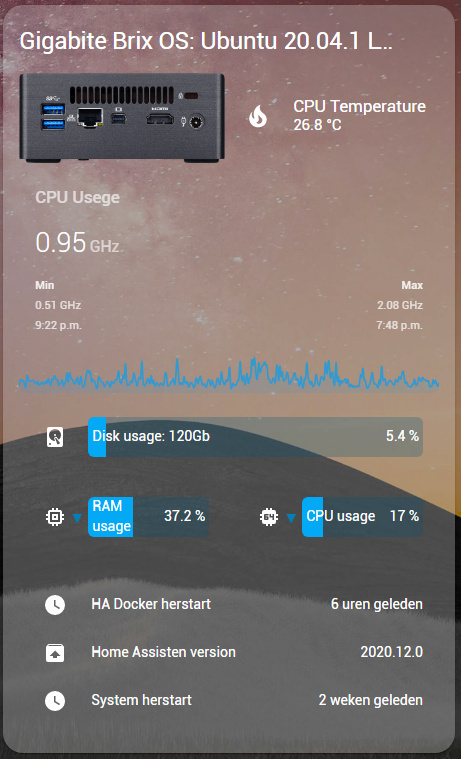
This is what it looks like:

Will also include my NUC picture:

Custom cards needed for this to work:
card-mod
mini-graph-card
config-template-card
button-card
bar-card
hui-element

configuration.yaml: (change names in the card to match these if you already have these and don’t want to rename them)

sensor:
  - platform: systemmonitor
    resources:- platform: systemmonitor
    resources:
      - type: disk_use_percent
      - type: disk_use
      - type: disk_free
      - type: memory_use_percent
      - type: memory_free
      - type: processor_use
      - type: memory_use
      - type: swap_use
  - platform: version
    source: local
    name: HomeAssistant Version
  - platform: command_line
    name: "cpu_temperature"
    command: "cat /sys/class/thermal/thermal_zone2/temp"
    unit_of_measurement: "°C"
    value_template: '{{ value | multiply(0.001) | round(2) }}'	  
  - platform: uptime
    name: "uptime"
  - platform: template
    sensors:
      disk_total:
        value_template: "{{ ( states('sensor.disk_use')|float + states('sensor.disk_free')|float )| round (1) }}"
      homeassistant_uptime:
        friendly_name: HomeAssistant Uptime
        value_template: >-      
          {%- set up_time = as_timestamp(now())-as_timestamp(states('sensor.uptime')) %}

          {%- macro phrase(name, divisor, mod=None) %}
            {%- set value = ((up_time // divisor) % (mod if mod else divisor)) | int %}
            {%- set end = 's' if value > 1 else '' %}
            {{- '{} {}{}'.format(value, name, end) if value | int > 0 else '' }}
          {%- endmacro %}
          
          {%- set values = [ 
                     phrase('week', 60*60*24*7), 
                     phrase('day', 60*60*24, 7), 
                     phrase('hour', 60*60, 24),
                     phrase('min', 60)
                 ] | select('!=','') | list %}
                        
          {{ values[:-1] | join(', ') ~ ' and ' ~ values[-1] if values | length > 1 else values | first }}

And card:

id: nuc_status
type: custom:config-template-card
variables:
  - states[''sensor.disk_use_percent''].state
  - states[''sensor.homeassistant_version''].state
  - states[''sensor.disk_total''].state
  - states[''sensor.disk_use''].state
  - states[''sensor.memory_use_percent''].state
  - states[''sensor.processor_use''].state
  - states[''sensor.cpu_temperature''].state
entities:
  - sensor.disk_use_percent
  - sensor.homeassistant_version
  - sensor.disk_total
  - sensor.disk_use
  - sensor.memory_use_percent
  - sensor.processor_use
  - sensor.cpu_temperature
card:
  type: entities
  show_header_toggle: 'off'
  style: |
    .card-header {
      padding: 0px 0px 0px 0px !important;
    }
  entities:
    - type: section
      label: '${ ''NUC i5 --- Ubuntu 18.04.1 LTS --- HA Version '' + vars[1] }'
    - type: custom:hui-element
      card_type: vertical-stack
      cards:
        - type: horizontal-stack
          cards:
            - type: picture
              style: |
                ha-card { 
                    --paper-card-background-color: 'rgba(0, 0, 0, 0.0)';
                    --ha-card-background: "rgba(0, 0, 0, 0.0)";
                    --ha-card-box-shadow: 'none';
                }
              image: /local/images/intel_nuc.png
            - type: custom:button-card
              layout: icon_name_state2nd
              show_icon: true
              show_state: true
              styles:
                grid:
                  - grid-template-columns: 50px auto
                icon:
                  - padding: 0px 0px
                  - height: 30px
                  - width: 30px
                card:
                  - '--ha-card-background': 'rgba(0, 0, 0, 0.0)'
                  - '--ha-card-box-shadow': none
                state:
                  - padding: 0px 10px
                  - justify-self: start
                  - font-family: 'Roboto, sans-serif'
                  - font-size: 15px
                name:
                  - padding: 0px 10px
                  - justify-self: start
                  - color: var(--secondary-text-color)
              entity: sensor.homeassistant_uptime
              name: Uptime
              icon: 'mdi:clock-outline'
        - type: custom:bar-card
          show_icon: true
          align: split
          columns: 1
          max: 100
          positions:
            icon: inside
            indicator: inside
            name: inside
            value: inside
          unit_of_measurement: '%'
          severity:
            - value: 50
              color: '#3498db'
            - value: 75
              color: '#f39c12'
            - value: 100
              color: '#e45e65'
          style: |
            ha-card { 
                --paper-card-background-color: 'rgba(0, 0, 0, 0.0)';
                --ha-card-background: "rgba(0, 0, 0, 0.0)";
                --paper-item-icon-color: 'var(--text-primary-color';
                --ha-card-box-shadow: 'none';
            }
          entities:
            - entity: sensor.disk_use_percent
          name: '${ ''Disk ('' + vars[3] + ''Gb/'' + vars[2] + ''Gb)'' }'
          entity_row: true
        - type: horizontal-stack
          cards:
            - type: custom:bar-card
              show_icon: true
              align: split
              columns: 1
              max: 100
              positions:
                icon: inside
                indicator: inside
                name: inside
                value: inside
              unit_of_measurement: '%'
              severity:
                - value: 50
                  color: '#3498db'
                - value: 75
                  color: '#f39c12'
                - value: 100
                  color: '#e45e65'
              style: |
                ha-card { 
                  --paper-card-background-color: 'rgba(0, 0, 0, 0.0)';
                  --ha-card-background: "rgba(0, 0, 0, 0.0)";
                  --paper-item-icon-color: 'var(--text-primary-color';
                  --ha-card-box-shadow: 'none';
                }
              entity: sensor.memory_use_percent
              name: RAM
              entity_row: true
            - type: custom:bar-card
              show_icon: true
              align: split
              columns: 1
              max: 100
              positions:
                icon: inside
                indicator: inside
                name: inside
                value: inside
              unit_of_measurement: '%'
              severity:
                - value: 50
                  color: '#3498db'
                - value: 75
                  color: '#f39c12'
                - value: 100
                  color: '#e45e65'
              style: |
                ha-card { 
                  --paper-card-background-color: 'rgba(0, 0, 0, 0.0)';
                  --ha-card-background: "rgba(0, 0, 0, 0.0)";
                  --paper-item-icon-color: 'var(--text-primary-color';
                  --ha-card-box-shadow: 'none';
                }
              entity: sensor.processor_use
              name: CPU
              entity_row: true
        - type: custom:mini-graph-card
          height: 30
          line_width: 2
          font_size: 70
          hours_to_show: 168
          points_per_hour: 1
          show:
            extrema: true
            fill: true
          style: |
            ha-card { 
              --ha-card-background: "rgba(0, 0, 0, 0.0)";
              --ha-card-box-shadow: 'none';
              border-radius: 5px;
            }
            .info.flex {
              font-size: 12px !important;
            }
          entities:
            - sensor.cpu_temperature
          name: Temperature
          color_thresholds:
            - value: 30
              color: '#3498db'
            - value: 50
              color: '#f39c12'
            - value: 80
              color: '#ff0000'

EDIT: If you want to center the blue text at the very top change the type section as follows:

    - type: section
      style: |
        .label {
          text-align: center !important;
          margin-left: 0px !important;
        }
      label: '${ ''NUC i5 --- Ubuntu 18.04.1 LTS --- HA Version '' + vars[1] }'

EDIT: Have now also played with uptime a bit to make it fit better especially with longer uptimes:

            - type: custom:button-card
              layout: icon_name
              show_icon: true
              show_state: true
              styles:
                grid: null
                card:
                  - '--ha-card-background': 'rgba(0, 0, 0, 0.0)'
                  - '--ha-card-box-shadow': none
                icon:
                  - padding: 20px 0px 0px
                  - height: 30px
                  - width: 30px
                state:
                  - padding: 10px 0px 0px
                  - justify-self: center
                  - font-family: 'Roboto, sans-serif'
                  - font-size: 14px
                name:
                  - padding: 19px 0px 0px
                  - justify-self: start
                  - color: var(--secondary-text-color)
              entity: sensor.homeassistant_uptime
              name: 'Uptime:'
              icon: 'mdi:clock-outline'
4 Likes

Possibilities are endless, here’s an example using 2 different themes:

3 Likes

Yep, just a forewarning, that template you’re using for uptime is something that I created. The text for that sensor will get chopped off when you get into days/weeks if you continue to use that sensor. I personally use this in places instead:

          {%- set up_time = as_timestamp(now())-as_timestamp(states('sensor.uptime')) %}

          {%- macro phrase(name, divisor, mod=None) %}
            {%- set value = ((up_time // divisor) % (mod if mod else divisor)) | int %}
            {%- set end = 's' if value > 1 else '' %}
            {{- '{} {}{}'.format(value, name, end) if value | int > 0 else '' }}
          {%- endmacro %}
          
          {%- set values = [ 
                     phrase('week', 60*60*24*7), 
                     phrase('day', 60*60*24, 7), 
                     phrase('hour', 60*60, 24),
                     phrase('min', 60)
                 ] | select('!=','') | list %}
                        
          {{ values | first }} ago
2 Likes

Thanks @petro

How does this one differ, how does it display?

Thanks in advance

And to anyone else interested thanks to @petro I’ve also come up with this for UPS: UPS System Monitoring Card

It just shows you the largest count. I.e. if it was 3 weeks 2 days 4 hours… etc… ago, it would say 3 weeks ago.

2 Likes

Using HASC, I was able to install the following cards today:

card-mod
mini-graph-card
config-template-card
button-card
bar-card

BUT, I still get an error: “no card type configued”

and I’m also seeing this at the bottom:

UI editor is not supported for this config:

  • Cannot read property ‘setConfig’ of undefined

You can still edit your config in YAML.

Prob an error in the code, add a new card, choose manual at the bottom, delete everything in the box so it’s completely clear, copy code from above post and paste into box, change entity ID’s to match yours

1 Like

There is a small typo in your card:
- 'states[''sensor.disk_total''].state'
Should read:
- 'states[''sensor.disk_free''].state'

Your instructions to create the sensors didn’t include disk_total, leading to a blank card… I guess you had it defined somewhere else and so the card worked for you.

Can someone explain how to do this…for a beginner?

Thanks @Redpizza I didn’t notice this

I have edited my post to include making the total sensor and corrected the card from free to total so it should work now

Thanks

Has anyone worked out how to pick up the version of operating system, rather than hard-coding it. I tried:

platform: command_line
name: "operating_system"
command: "grep PRETTY_NAME /etc/os-release | sed 's/PRETTY_NAME=\"//' | sed 's/\"//'"

but that just give me Alpine, as I’m running in a docker - duh! On the Supervisor tab, under System you get the underlying OS - any idea how to get that?

That’s a tall order. I recommend starting with searching the forums for HACS (Home Assistant Community Store) and learning how to install it. It will allow you to install custom cards. Then install all the custom cards used in this setup. Once that’s done, you’ll have to learn each custom card and it’s attributes or you can try to replace the current entities that are used.

sensor:
  - platform: version

EDIT: Nevermind, haven’t had my morning coffee. I thought you said HA version. There’s a way to do what you want, let me find it.

This post by @CentralCommand appears to get information from the supervisor. This method probably has the ability to get the OS and it’s version. He might be able to confirm that.