One wrong value every night

For the last couple of weeks I am having the issue that the energy dashboard shows ONE totally off value between 4 and 5 am which destroys the whole dashboard and statistics:

I can manually correct it hen everything is fine

But it happens every night between 4 and 5 am - does anyone have an idea what that could be - I have prepared a cron-job deleting negative values between that timeframe and started testing it but would like to actually solve the root cause of it…

What is odd that both your production as well as consumption show a peak, seems to be a correction.
Are you calculating one value using the other?

Share your sensor configurations. Also share the energy history graphs for the sensors around the time this happens.

Is this sensor a total consumption-sensor or one that resets every day? If it is the latter, than that is probably the reason.

Is there a trick - it says I can only add one screenshot - should I post 6 replies now or create a PDF ?

Try posting the images now.

Alright - this is my current dashboard:

Grid Import Sensor History looks good:

Grid Export:

Solar Production:

Watermeter:

All sensors are MQTT sensors configured as Total Increasing

Only Grid Import and Export are coming from the powermeter over modbus but also configured as Total Increasing.

modbus:

  • name: hub1
    type: serial
    baudrate: 9600
    bytesize: 8
    method: rtu
    parity: E
    port: /dev/ttyUSB0
    stopbits: 1
    sensors:
    • name: sdm630_total_power_import
      slave: 11
      address: 72
      input_type: input
      count: 2
      precision: 2
      data_type: float32
      unit_of_measurement: kWh
      device_class: energy
      state_class: total_increasing
      scan_interval: 1800
    • name: sdm630_total_power_export
      slave: 11
      address: 74
      input_type: input
      count: 2
      precision: 2
      data_type: float32
      unit_of_measurement: kWh
      device_class: energy
      state_class: total_increasing
      scan_interval: 1800

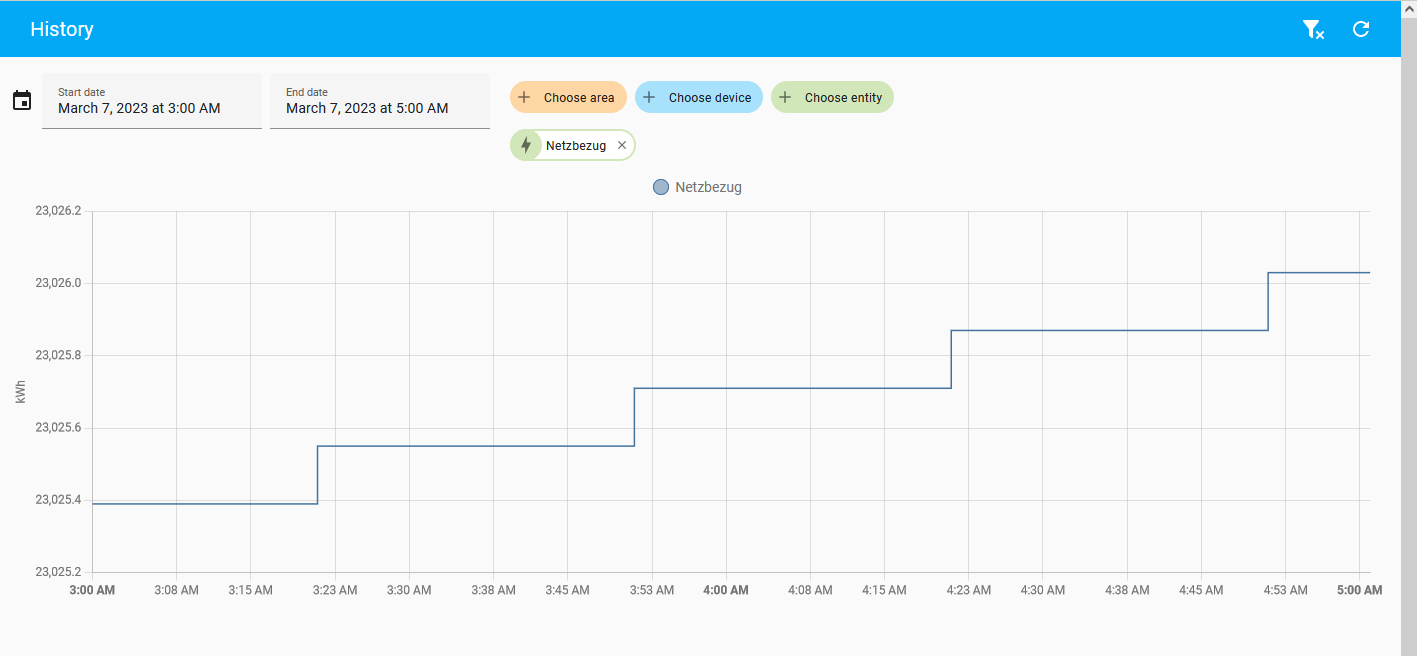
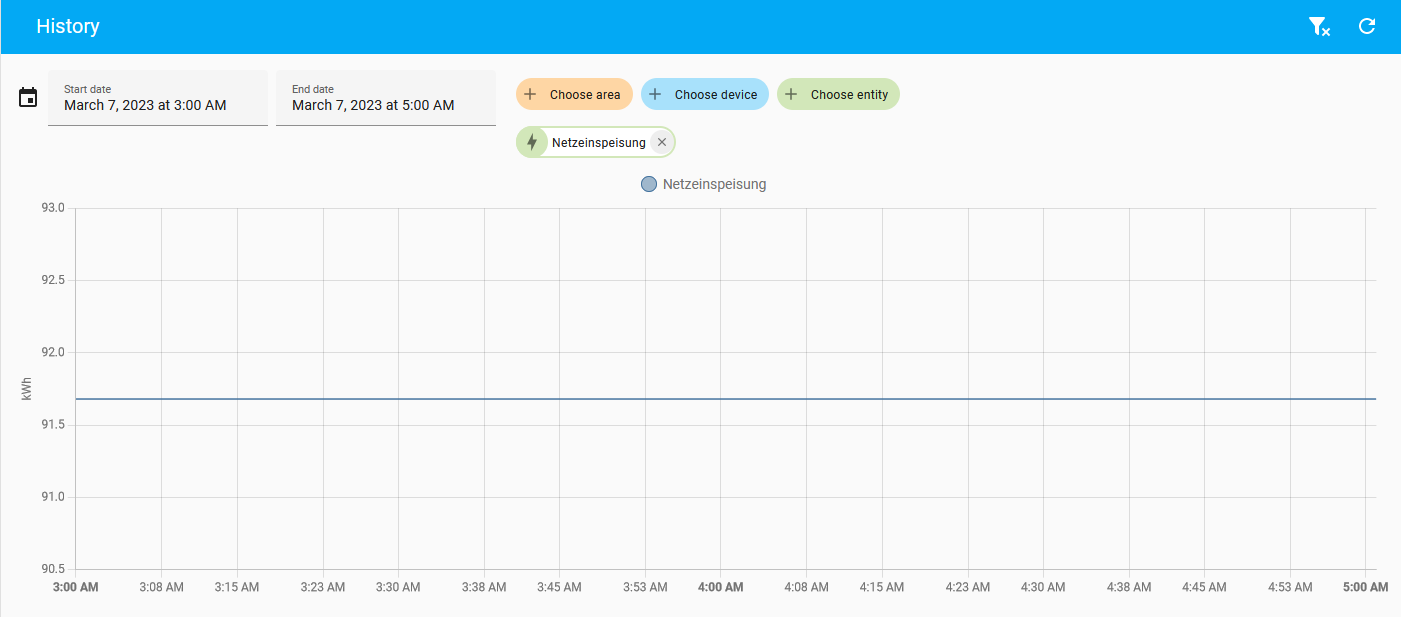
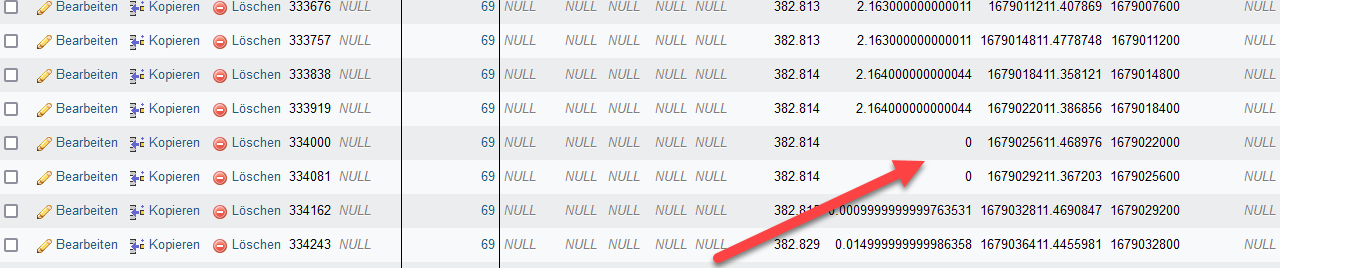
So I double checked again - the history graphs of all sensors are correct - only in the dashbboard it shows wrong - I think there the statistic values are used - they are wrong - why I do not know:

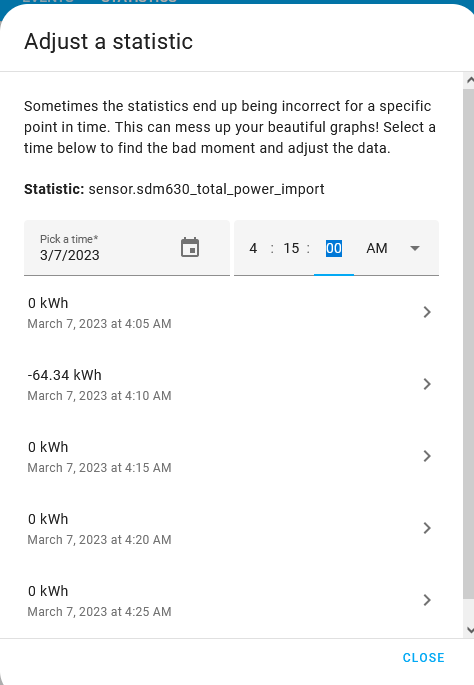
So here for examle - Grid Import - all of the sudden at 4:10 am - the import was minus 64,34 - so a negative value…

Also the solar production (the PV is offline during night) the statistic shows at the same time a negative production:

Show the configuration for sensor.fritz_dect_210_total_energy and format it properly.

Can you pls help me where I find it ? I have not added this sensor manually as it was auto discovered:

Never mind. What does its history look like?

Last night only:

The History Graphs all look perfectly fine- only increasing- no negative values or peaks…

Any idea what that coule be ?
It happens almost every day but not all days…

Is there a way to delete maybe ALL statistics if that is causing the issue but not the histories ? The histories all are fine…

What I also found out in the DB at that time - the sum of changes to 0 and seems to restart to count from there…

Then I can’t explain it. Statistics are generated from this state.

It is very very strange but I am not alone → Statistics reset to zero every now and then - #9 by PaStaDA
@sedael has the very same issue obviously :frowning:

I saw today somewhere that at 04:10 the database is purged automatically, maybe that has some relation?

LTS are not purged. Only state values and events.

Still noone with an idea why that happens ? It really happens almost every night now and with all “Energy” sensor - so now even my watermeter reports every night that I have “exported thousands of liters to the grid” :frowning: Can I somehow delete the whole LTS and also if needed the history - I am now so frustrated that I even would delete all data from the last years to get a clear picture - with these wrong values in the dashboard, it becomes totally useless

I have the same problem. I have nothing changed the last few months except updating home assistant and suddenly it behaves like this so i am pretty sure that’s another bug.

@PaStaDA and @Zahnpasta1

Just a thought from a novice. Maybe the database purge isn’t working correctly. :man_shrugging:

You could try TEMPORARILY disabling the purge to see what happens. See:
Recorder Integration

FYI I use MariaDB rather than the default SQLAlchemy. Also, lot of folks using RPi’s have issues with SD card memory. Here is an article on Maria DB:
Optimize Your Home Assistant Database