cisor
1
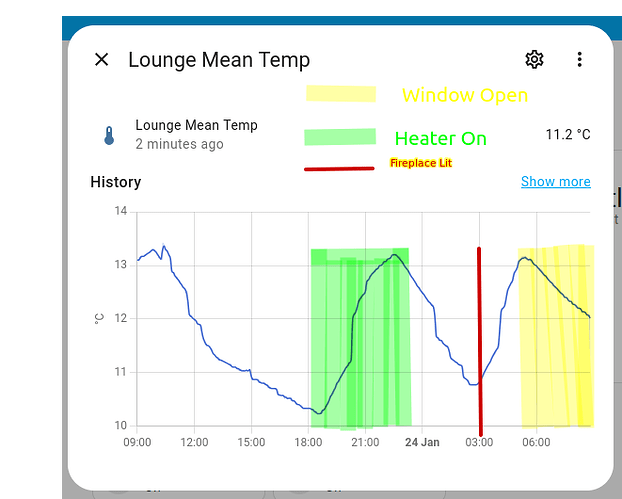
I’d like to create a visualization that shows several types of data
- a line graph of variable data like temperature
- state of sensors when in a specific state like “Window is Open”
- one-off events like “Fireplace Lit” (this has no end time)
Can this be done in Home Assistant or do I need to push the data to another system to do this type of thing?
Thanks!
Go to the main thread of custom mini-graph-card.
cisor
3
Do you have a link for me?
Search returns too many results!
Threads dedicated to particular custom cards or plugins are located in “Share your projects”.
cisor
6
That looks great, very detailed. Thanks for the link
Chykan
(Hunter)
7
Final Card in above link.
