Platinum Weather Card Plus Charts — charts, local Zambretti forecast from your own station, 13 languages

Hi all,

This is a maintained fork of the well-known platinum weather card. The original hasn’t seen updates in a couple of years, and I’ve been extending it since — first with a charts section (temperature lines and precipitation bars under the daily forecast), and by now with quite a bit more. Figured it deserves its own topic instead of living on page 9 of the original card’s thread.

Repo: GitHub - rudizl/platinum-weather-card-plus-charts: A mashup of Platinum Weather Card and Weather Chart Card for Home Assistant — highly configurable weather card with integrated temperature/precipitation chart and hover tooltips. · GitHub

The headline feature of the latest release (v2.1.0) is one I haven’t seen built into a general-purpose weather card before:

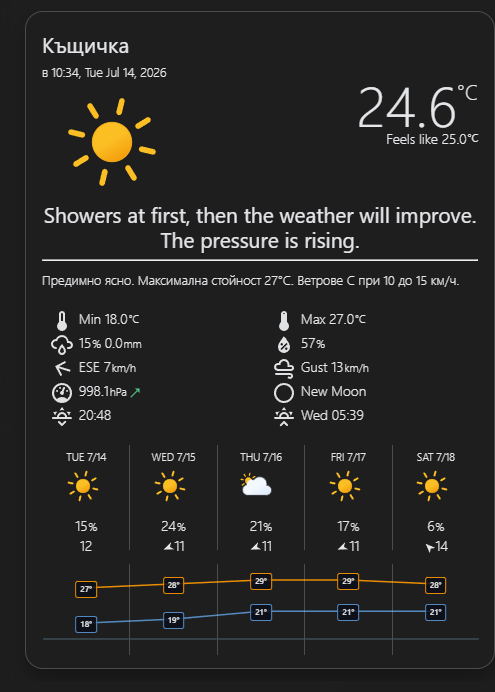
Local weather forecast, computed from your own weather station. If you have pressure, wind direction and wind speed sensors, the card can generate a short forecast text entirely locally — no forecast provider, no internet. It implements the Zambretti forecaster, an algorithm from 1915 that reads barometric pressure, its trend, wind direction and season, and is surprisingly good at short-term forecasting (roughly 90% accuracy for the next 12 hours).

There are dedicated Zambretti integrations for HA that do this with their own companion cards — the difference here is that there’s nothing to install or configure beyond the card itself: it’s a toggle in the card editor, computed in the frontend from the sensors the card already knows about.

There’s a compact mode (“Fairly fine, showers likely”) and a verbose one (“Showers at first, then the weather will improve. The pressure is rising.”). Unit conversion, sea-level correction for absolute-pressure sensors, and smoothing for stations that report every few seconds are all handled. The 26 forecast texts are translated into the card’s 13 languages.
What else the fork adds over the original card:

  • Charts section — temperature lines and precipitation bars under the forecast, with hover tooltips
  • Barometric pressure trend indicator — a colored arrow (rising/steady/falling) next to the pressure value, driven by a derivative helper or any trend sensor
  • Wind bearing as a rotating arrow instead of compass text (optional)
  • Optional date next to the day name in the daily forecast
  • Icon packs (Meteocons fill/line and others), fully translated editor, 13 UI languages

Installation is via HACS as a custom repository for now — the default-store PR is in the review queue. Setup docs and full changelog in the README.

One request: most non-English translations are machine-generated, and weather phrasing is exactly the kind of thing that sounds off to native speakers. If you can spare ten minutes for your language: Translations: native speakers wanted. A PR or just a comment with corrections — either works.

Questions and feedback welcome — this thread is the right place for support on the fork.
1 Like

v2.2.1 is out. Two bug fixes, and one thing worth reading even if you don’t use this card.

If your local Zambretti forecast has been pessimistic, check your station calibration. The algorithm reads the absolute pressure level, so a station that reports raw station pressure instead of sea-level pressure throws the forecast off by several categories — permanently, not occasionally. Mine sits at 154 m altitude and was reading about 18 hPa low: the card saw 1002 hPa and said “changeable, some rain” while the real sea-level pressure was 1020 and the sky was cloudless. It had been quietly wrong for weeks and I assumed the algorithm was just mediocre.

The check takes ten seconds: compare your absolute and relative pressure sensors. If they read exactly the same, your station isn’t applying any correction. On Ecowitt gear the fix is Calibration → “Altitude for REL” (not “Abs Offset” — that one corrects the absolute reading, which is already right). Or leave the station alone and fill in the card’s “Station altitude” field instead. Not both, or you’ll double-correct. The README now documents all of this.

Worth noting this affects anything else consuming that sensor — my station had been uploading wrong pressure to Weather Underground all along.

The two fixes:

  • Chart and forecast strip could disagree about how many days to show. The strip resolves days by date, the chart used array indices, and just after midnight the two drifted apart — the chart drew an extra day, starting one day earlier, so every point sat under the wrong column. Now both walk dates identically.
  • Wind bearings in Cyrillic weren’t recognised. Weather Underground returns them localized and mixes them with the Latin ones in the same response — a real five-day array here read Ю, NNE, ESE, SE, И. Those days silently lost their wind arrow, and the Zambretti forecast dropped its wind correction. All 16 Bulgarian abbreviations plus the Russian/Ukrainian В family are now parsed.

As always, if the card’s texts sound off in your language, corrections are welcome — everything lives in one file per language.

The original Platinum weather card never worked nicely for me - but this one is great! Particularly the mixture of real/observed (from a local weather station) data & a forecast. Being able to click one of these observed readings & see the history is even better!
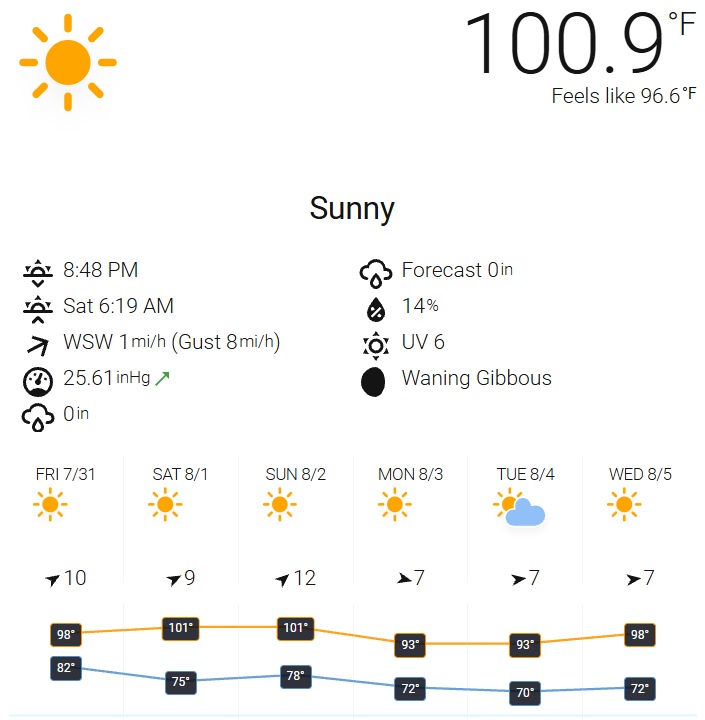
One (“trivial”?) request; would it be possible to see a history on clicking the main/current temperature reading (the “100.9” - yes, it’s a warm one today!)? (And maybe the “feels like” too?)


Thanks!
Sandy

1 Like

Thanks Sandy, that’s good to hear — and the request isn’t trivial at all. Now that you point at it, it’s an obvious inconsistency: if every observed reading in the slots is clickable, the biggest number on the card has no business not being.

Added for both the temperature and the “feels like” value. It’s in v2.2.3-beta.2 if you’d like to try it (HACS → Redownload → tick “show beta versions”), and it’ll land in the next stable release once it’s had a few days of use.

Same behaviour as the slots: only clickable when it’s backed by a real sensor, and the card’s own tap action stays untouched.

While testing this I also caught a related bug that’s been there since the slot taps landed in 2.2.0: the card starts its hold timer on pointerdown, which had already propagated by the time the tap handler stopped the click — so a long press on any clickable reading also fired the card’s hold action. Fixed in the same beta. It only ever showed up if you had a hold action configured on the card, but worth knowing if you did.

Small milestone: the card is now in the HACS default store — no more custom repository needed. Search for “Platinum Weather Card Plus Charts” in HACS → Frontend and it’s there.

Thanks to @frenck for the review, which caught an XSS issue in the tooltip code before this went out to a wider audience. The tooltips were assembled as HTML strings and passed through unsafeHTML, with forecast descriptions and unit strings coming straight from entity attributes — so crafted attribute data could have injected markup. Fixed in v2.2.1, along with the type checking that should have caught the class of problem in the first place and had quietly been broken for months.

If you installed the card as a custom repository, nothing breaks — but you can remove the custom repository entry if you like, updates will come through the default catalog either way.

Thanks, and perfect, that’s exactly what I was thinking! (Didn’t even get a chance to try the beta; released before I was up - US Mountain time)

1 Like

Ha — the perils of a maintainer in a European timezone. Glad it landed the way you had in mind.

While it’s fresh: the same tap opens the history for any slot value too, not just the temperature. Worth knowing if you have observed readings you check often.