Thanks for your reply, unfortunately I am too dumb or it does not work:
the integrate does not work, however i try integrate by h or otherwise i get more datapoints than before
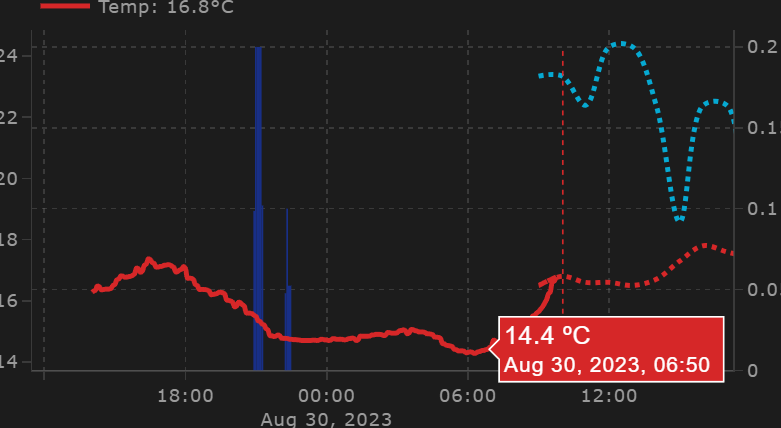
Raw Datapoints:
Integrate by hour

  - entity: sensor.local_precipitation
    xaxis: x
    yaxis: y1
    type: bar
    hovertemplate: >-
      <span style="text-align: center; font-size: 15px;">%{y:.1f}
      mm</span><br>%{x}<extra></extra>
    showlegend: false
    width: 25000
    opacity: 1
    marker:
      color: rgb (24, 47, 135)
    legendgroup: 2
    name: 🌧 Precipitation
    unit_of_measurement: mm
    filters:
      - integrate: h
optimally i would like to have 1 datapoint every hour with the sum of the datapoints of the hour before
im not skilled enough to write a function for that
- the filter x > Date.now has no effect unfortunately, even when i try to add an hour or more (in ms i suppose), i guess it does not work bc the datapoints are created by a function below??
  - entity: weather.openweathermap
    xaxis: x
    yaxis: y2
    legendgroup: 3
    showlegend: false
    name: Precipitation Propability
    line:
      color: rgb(0, 204, 255)
      dash: dot
    unit_of_measurement: '%'
    opacity: 0.8
    filters:
      - filter: x > Date.now
      - store_var: precipitation_p
      - fn: |-
          ({ meta, vars }) => ({
            xs: [vars.precipitation_p.xs.slice(-1)[0],...meta.forecast.map(({ datetime }) => new Date(datetime))],
            ys: [vars.precipitation_p.ys.slice(-1)[0],...meta.forecast.map(({ precipitation_probability }) => precipitation_probability)],
          })