Power consumed per day

No, what I did at first was using Domoticz just for the DSMR reading. Domoticz published every event on the MQTT bus. That’s how I was able to use NodeRed.

Since last week I’ve directly added it in HA. I’m not to happy with it atm. I liked the simple domoticz statistics.
Using node-red I logged the daily usage to MariaDB and influxDB.

Not sure I understand (I am not familiar with domoticz): are you not happy with the data as it comes out of DSMR? I guess you could write a sketch on the esp to read the serial data and have that publish an mqtt message, right?

No, It’s just the way Home Assistant handles the data.

Domoticz summarizes the data and creates some simple but usefull graphs.
I can see my daily, monthly total usage, costs etc.


Just a simple overview of my usage.

1 Like

Well, since you have all the data in MariaDB, and the dashboard you saw is in Grafana, there is no need for HASS to be involved, if it is only the dashboard you want. You would have to install Grafana (which is an add-on for HASS.IO if you are already running HASS), and within Grafana install MariaDB as a datasource to connect to your database. Then import the dashboard JSON from the repo and adjust to your setup. I made the dashboard based on the sensor names HASS creates and are stored in InfluxDB, hence the need for you to adjust to your MariaDB and probably other sensor/field names in the SQL.

1 Like

Can u please show us how to get graph as yours

hi @kirpat, the graph in @rtenklooster his post is from a different home automation software: Domoticz, so that is not something you will find in home assistant. It would be possible to make something similar in grafana, but home assistant does not provide such a graph.

Hi!

this is pretty awesome indeed, and exactly what I ws hoping to create someday…
Having all necessary sensors available in my HA setup, I was wondering if you could guide us through setting this up in Grafana/Influx (which I have already been able to setup too, or at least think so, didn’t use it to this day)

What would be the best way to start, collecting all data in this view?

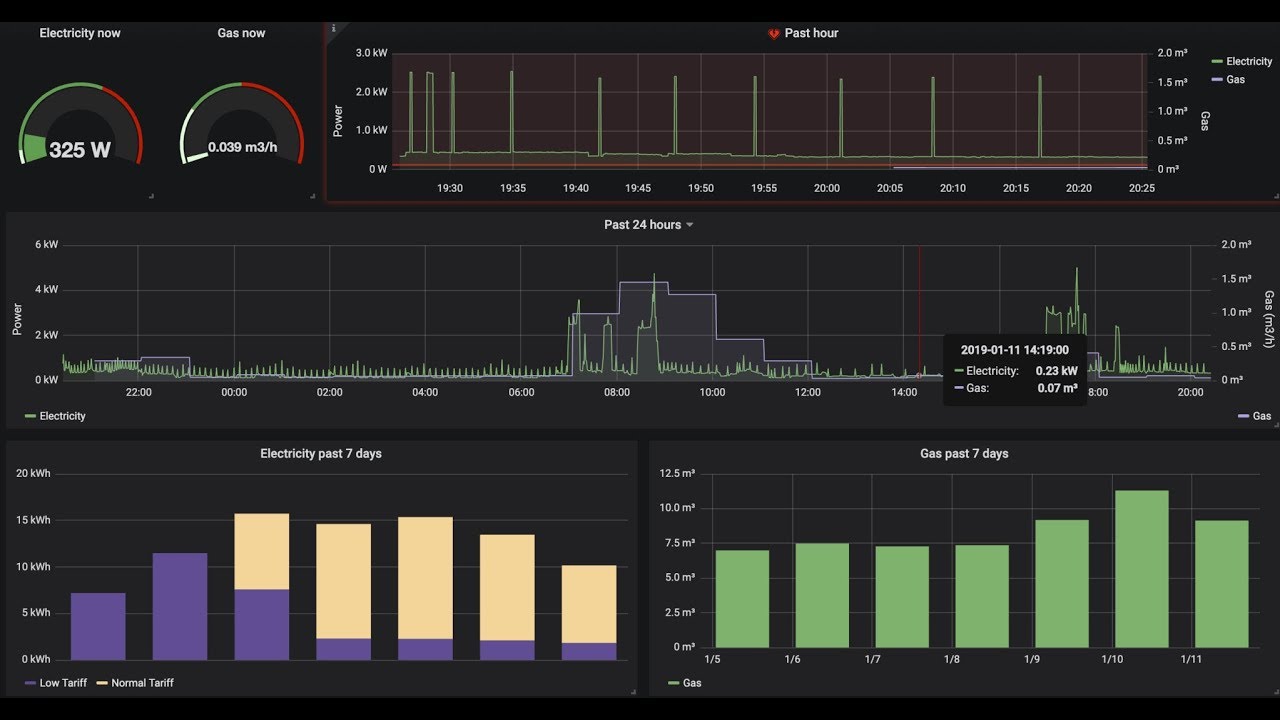
Hi @Mariusthvdb, have you seen the writeup I did on it? That article contains a link to a gitlab repo where you can find the code to import into grafana to get your own, assuming your setup is similar to mine:

You would then import the dashboard JSON from the repo and indicate what database to use (the one where your home assistant logs its data).

Hope that helps, if not, let me know, I can have a go at doing a screenrecording and put it on youtube or something.

yes, thanks, I did read it, but missed the import… which looks as if it is ready to use…very nice.

since Ive never really used Grafana yet, only set it up once to see influxdb, please help me with this:

  • how do I import this in Grafana?
  • I have all sensors available for the entities needed, but they are not derived from the Hassio dsmr component. where do I enter the entities/ sensors to use? Is that done in Grafana, or do I have to edit the import json manually first. If the latter, please tell me how?

thanks!

Hi @Mariusthvdb,

I did a quick screen recording to explain how to import the JSON from the gitlab repo into Grafana and some pointers where to make changes to the queries if you have stored the data using a different setup. Hope this helps!

1 Like

Video updated, please see above

This is so wonderful thank you! Managed my way back in to Grafana today and will try to import soon! Thanks a bunch. This needs a firm place in the Cookbook imho :+1:

1 Like

how do i know if this is compatible with my energy provider and or gas provider?

Hi @david1, I am not sure I understand your question, but this is what I can think of:

With respect to creating a grafana dashboard for energy consumption monitoring:
This dashboard is fed using data on energy consumption. It does not really matter if it comes from a smart utility meter, or some other system that is able to provide this data. For example: If you have a smart plug or switch that provides power monitoring, you could use that as source for the electricity graphs. It would not graph “whole house electricity consumption” but “appliance electricity consumption”, but could still be useful.

But if you have a utility meter that is able to provide a serial output that you can tap into, you could use that data to create similar graphs.

With respect to the setup of capturing data from a smart utility meter into home assistant:
If you are able to get data from your smart meter using the DSMR component, you’re in good shape. The component page shows various utility meters that the component is compatible with, but the D in DSMR stands for Dutch. So, I am not sure if or how well it works for smart utility meters that are not located in Holland.

Having said that; there are currently 26 components in the “Energy category” in home assistant, maybe one of those can help provide meaningful data for energy consumption monitoring and analysis for your setup. Or, add a new years resolution to your list for 2019 and try to develop a component yourself if you haven’t already :slight_smile:

Thanks, very nice words! Not sure if this qualifies for the cookbook, since most of this stuff is done outside of home assistant. But, I’d be happy to see if it can get a spot there. For me, this dashboard is only step 1 in a longer journey to monitoring energy and finding ways to measure the impact of changes in the house to reduce energy consumption. I’ll make sure I will share it all here and on the blog :slight_smile:

you bet it does, since many people are willing to integrate InfluxDB and Grafana because of the huge load the default db puts on HA and it can be very confusing to have it work as you want it to with includes and excludes etc.

In my instances, I have 2 RPi installs, I have never been able to use History or the logbook because that would halt my setups. Admittedly I use many entities but even selecting only a few in recorder settings didn’t change that.

So went from the default to MariaDB which at least stopped the ridiculously heavy writing to the .db file.

But, I still use that mainly for history graphs HA and restore state.

Now that it comes to using the DB for analytics and changing behavior because of that (insight in power consumption…) we need extra tools and Influx DB and Grafana are the first choice apparently. I have them setup thanks to @philhawthorne s setup instructions (Getting Started with Grafana & InfluxDB for Home Assistant – Phil Hawthorne) which is a great writeup. Adding your instructions and import file would be the second step in creating a great tutorial for us HA users with their hands in their hairs…

So definitely a big yes to share and the blog. I have bookmarked it!

ps you might have a look to the Hassio add-ons for Grafana and Influxdb by @frenck . I’ve not used them yet, because I want to keep my Ha setup as light weight as possible, but it might be worth an extra look to see if your setup could serve as a great guide for that too.

last question for now: I’ve set MariaDB as a source for recorder. (as said don’t want the heavy writing/reading to the SdCard.) Using InfluxDB, would that in any way conflict? Can’t say I notice that at all, but maybe you have extra info/advice on that aspect?

Regarding your question: there is no conflict in a setup if it uses two databases, e.g. MariaDB and InfluxDB. You are keeping 2 copies of some data though and if you are worried about a lot of read/write actions to an SD card, that will definitely not reduce that amount. :slight_smile:

InfluxDB is optimized for time series data, and a typical home assistant will not be taxing Influx in any serious way. Most of us are using an infinite retention policy, which means you can run out of storage fairly quickly if you are storing each and every state change in your home assistant system.

About your ps: I know about the community addons, that is why I mention them in the video as great ways to quickly get you up and running with influx and grafana in combination with home assistant. Don’t use it myself though, all those components are part of a docker-compose file in my setup.

so I managed to do that:


I obviously need some editing… There is no way I can find edit fields in the interface, cause his is all I see.

Probably need to edit the json, and point to my Homeassistant entities but I can’t seem to find the relevant entries in your Json, which only uses a few as far as I can see?
would you be willing to guide me a bit further? The editing you show in the video can one be done when a graph is shown a all, and since my screen is as it is, that’s not yet possible.

which sensors do you use, and where are they in the Json?

If I open the Json in the Grafana window, most of it has gone and I only see this:

{
  "annotations": {
    "list": [
      {
        "builtIn": 1,
        "datasource": "-- Grafana --",
        "enable": true,
        "hide": true,
        "iconColor": "rgba(0, 211, 255, 1)",
        "name": "Annotations & Alerts",
        "type": "dashboard"
      }
    ]
  },
  "description": "Overview of electricity and gas usage in the house",
  "editable": true,
  "gnetId": null,
  "graphTooltip": 0,
  "hideControls": false,
  "id": 3,
  "links": [],
  "refresh": "10s",
  "rows": [],
  "schemaVersion": 14,
  "style": "dark",
  "tags": [],
  "templating": {
    "list": []
  },
  "time": {
    "from": "now/d",
    "to": "now"
  },
  "timepicker": {
    "hidden": true,
    "nowDelay": "",
    "refresh_intervals": [
      "5s",
      "10s",
      "30s",
      "1m",
      "5m",
      "15m",
      "30m",
      "1h",
      "2h",
      "1d"
    ],
    "time_options": [
      "5m",
      "15m",
      "1h",
      "6h",
      "12h",
      "24h",
      "2d",
      "7d",
      "30d"
    ]
  },
  "timezone": "browser",
  "title": "Energy usage",
  "version": 0
}

fyi, my homeassistant instance is on a rPi, and both my Grafana an Influxdb are on my Synology NAS.

Proof of the connections working correctly:

I updated the json slightly to make sure all graphs reference the explicit HASS db reference (some were using the default db whatever that is on your system). Also, you need to select an influxDB data source when importing. The JSON does not contain the plain queries as they are executed against the database.

It may be that you did not copy all the json from the source? That can happen when you manually select and copy, instead of use the “copy source to clipboard” button. Another way is to view the raw json code and copy/paste that fully: https://gitlab.com/clevercrib/energy-dashboard/raw/master/energy-usage-dashboard

For the “Electricity now” gauge, I am using the sensor.power_consumption values from home assistant, that is specified around line 156 of the json.

“Gas now” gauge is based on sensor.hourly_gas_consumption

The “Past hour” and “24 hour” graphs are both using those sensors to select values from to display as well

The “Past 7days electricity” graph uses manually edited queries and are specified (with escape characters!) in the json on lines 727 and 777 for low tariff and high tariff respectively.

The “past 7 days gas” graph uses the query from line 910 of the json.

In those queries you see entity id’s as they are used in home assistant when you have setup the DSMR component.

So, recap:

  1. Make sure you copy all the json from the source when importing
  2. Select the correct influxDB at the “HASS” reference when importing
  3. If required, click on the titles of all the graph panels and select “edit…” from the drop down, to edit the queries.

As far as I know, if you have done steps 1 and 2 you should at least have the graphs gauges showing, maybe empty and the “No data points” message, but you should see the outline. Then, you can go in and to step 3: edit the queries to select the correct values from your database if they don’t match mine.

Hope that helps!

thanks for your effort… it remains empty. This it what I do:

new dashboard, paste json (uploaded the file before after having it saved locally, no difference in the end result)

accept the name (prove it has been loaded correctly…) and select Home Assistant as HASS db, click import:

empty page…