Hi Eltjo,
Wanted to edit the .js file as well, however my changes are not reflected in the UI. Am I missing something?
Hi Eltjo,
Wanted to edit the .js file as well, however my changes are not reflected in the UI. Am I missing something?
Hi, what I did was pretty easy. I opened the file with File editor and find+replace the “kW” with “kWh”. I believe there are six “kW” in the file.
BUT… you have to clear your cache! So in Chrome or browser and on mobile via the settings of your phone (Apps → Clear cache)
That was it for me!
Maybe give option for kWh also 
This is not good advice and the reason your values don’t add up. It’s similar to saying something is 10km away and now you replace km with km/h. You can’t do this — not if you want it to be correct. That was what Tom was trying to point out to you.
My calculated values are correct, 100% certain since I have an alternative monitoring system.
For me there is no harm in changing this value since it is a representation of the calculated values. In my case the used and produced energy for a day.
At midnight the values are reset and during the day the values go up.
Again, for my purpose this is perfect. If you don’t know how to calculate energy yes then you can get maybe some strange results.
Just for clarity sake. I don’t have any intention of supporting or adding an option for kWh. If the builtin cards don’t work right or the integration being used doesn’t work right then issues should probably be opened there. That said, if anyone wants to hack on the “compiled” javascript or fork the source, that’s totally fine by me, enjoy yourselves  But obviously I can’t support that.
Must have been the cache then. Meanwhile updated to the last version using HACS. Works like a charm now. Thanks!
@ulic This is exactly what i was looking for. The instant power production/consumption
But i can not make it work… i install the repository via HACS latest version, i see it has created the power-flow-card directory and files in www/community , the resource is added to the Dashboards, but i can not find the actual card to add it to the dashboard.
little help pls? 
@Momo Thanks! I’m glad you like it. The card currently only supports manual configuration. Meaning there is no GUI editor. So you could select the “Manual” card and then fill out the configuration from there.
In the next release I’ll make it so that you can pick it from the list of cards, but it will still be a manual configuration. At some point I may get around to a GUI configuration, but no telling when that might happen.
aha good:) got it !
now i have
where power_house is total house consumption, power_to_grid is what i am sending to grid, and power_solar is total solar production.
But the numbers are not correct: in reality power_to_grid is 0; power_solar is 0.5 kW BUT the power_house is 3.4 kW.
I’m sure i put those sensors wrong…
Never mind I sorted it !
Documentation says:
consumption: sensor.grid_out
production: sensor.grid_in
And i was confused as my consumption is power_from_grid and production is power_to_grid in this case.
All good now !! Thank you !!
@Momo JFYI, As you may notice the numbers don’t add up. This can happen anytime round is involved. If it bothers you, you can set the number for decimal places to show or set a watt threshold to always show watts. Personally I’m not using this for science, so the rounding doesn’t bother me so much.
yup saw that. i added 2 decimals, the watt threshold is a very nice touch also
This feature will be in next release.
Thanks! Just got around to updating.
This card is excellent, thankyou! It’s really handy to be able to place the energy distribution card and your card side by side.
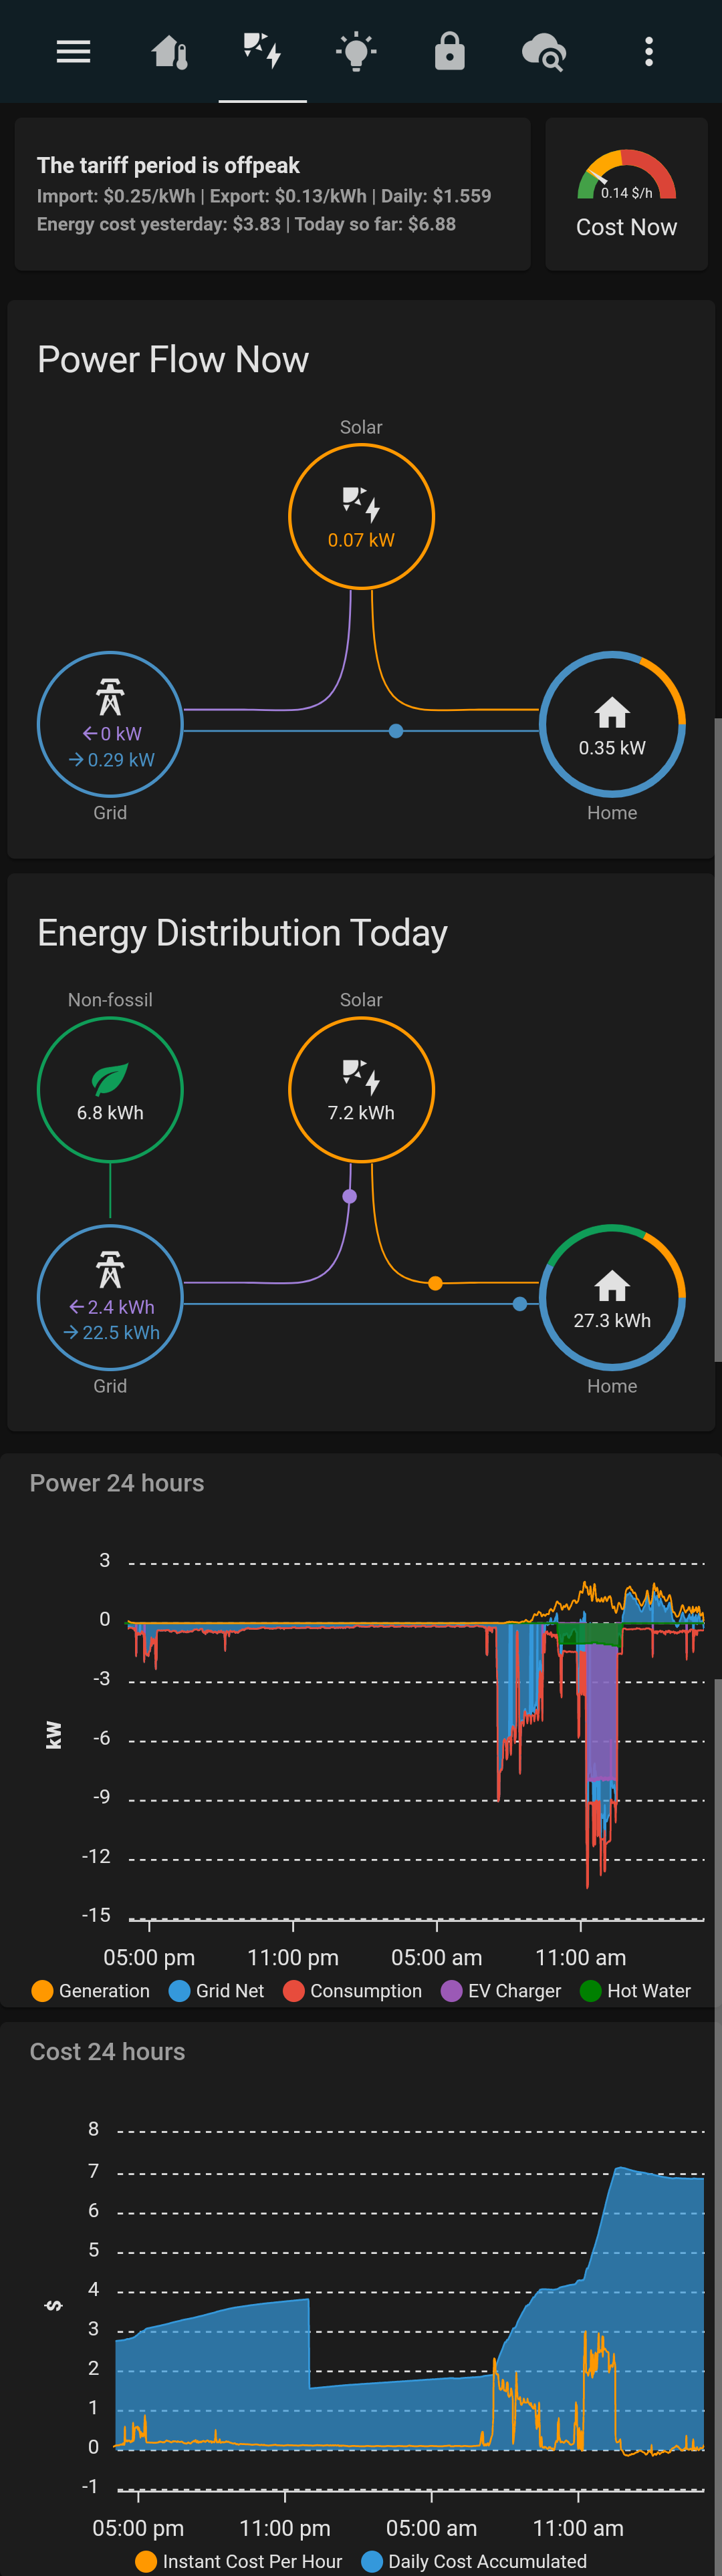
Below is my energy view, all the figures are real time (1s for readouts and 1m for graphs) really rainy here today as you can see so my 17kW of solar isn’t doing much, so an older screenshot included too 
It would be awesome if we could do the same for the energy card, simply so we aren’t stuck with an hour delay on energy figures.
Is it also possible to use the same source for grid carbon footprint to give a real time view of how green your power is?
Likewise as others have asked, a way to add individual loads would be cool but that’s easy for me to say sitting here with no idea how much work that takes! Thanks for your efforts.
May I ask you, what graph card are you using for the “Power 24 h”? looking really nice
And what settings do you use?
I’m using mini-graph card, but yours is much clearer
Sure, it’s apex charts: https://github.com/RomRider/apexcharts-card
Heaps of options. I’m getting the data from my enphase system which has consumption and production monitoring. It’s taken a bit of fiddling but happy with the output. It gives a much bigger view in landscape or desktop too.
Many thanks!
Do you mind sharing your code as I see there are many opions.