I have an aquarium that uses various devices that draw power.
Everything connects through one smart socket that can measure power/energy. (so I have an over-all measured usage).
Then there's a 4-gang smart socket that can turn some of the devices on/off-but it can't measure power.
I've measured and then defined various virtual devices in powercalc, like the air pump that uses X when its turned on, the filter that uses Y etc. These are switched through the 4-gang socket, so HA knows when they're on/off and powercalc applies the manual values I measured accordingly.
The light and heater are both 'dumb' devices and don't go through the switched 4-gang sockets, so HA has no direct way to know when they're on or what they're using.
So I created a group that subtracts the sub-devices from the total and labels the remainder 'light and heater'. So I have this at the moment:
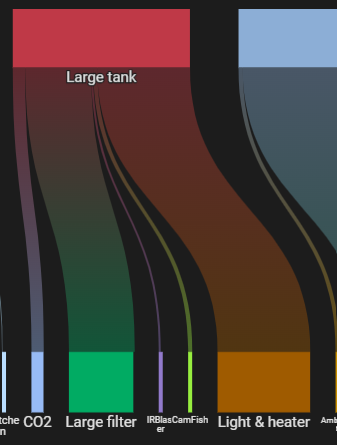
I'd like to split the remainder into separate light and heater virtual devices..
Looking at what they draw it's easy to see what's using what, but I'm not sure how to separate them using powercalc/HA:
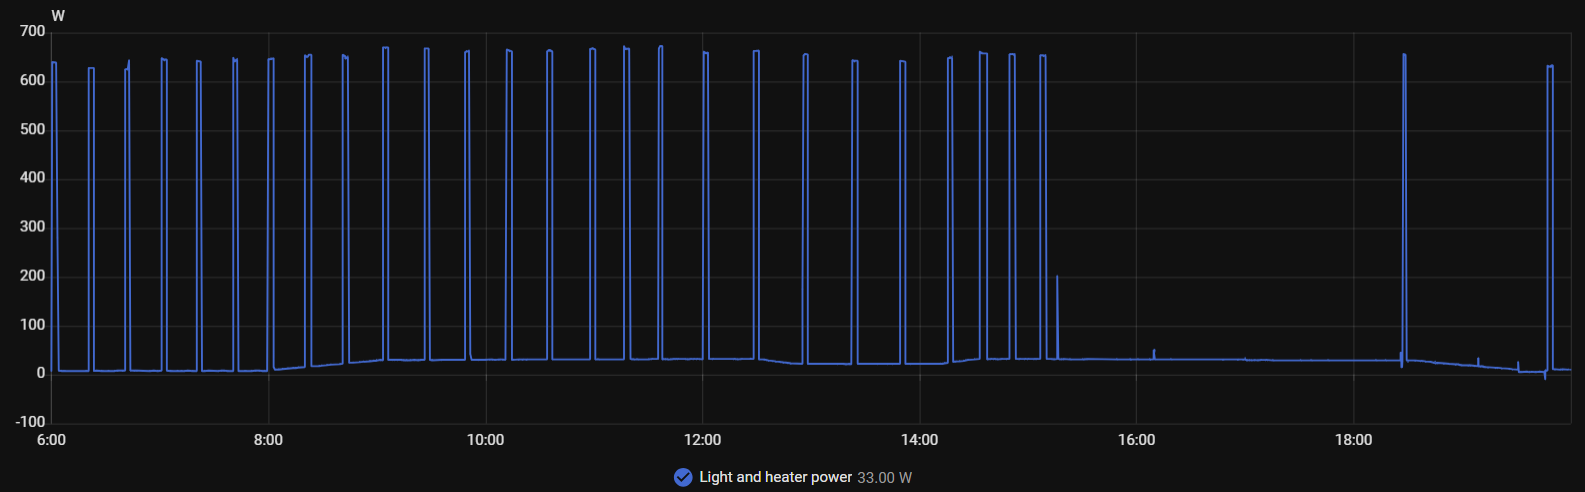
The spikes are when the heaters heating. The much lower shallow bumps are the light going through it's 24hour lighting period.
(The spikes would usually continue for the whole day, but I cleaned the tank yesterday-the long gaps in the spikes aren't there on the average day)
The light ramps up and down during the day, so a simple 'anything over x is the heater' approach wont quite cut it.
Does anyone know a way to separate the heaters large spikes from the lights shallow bumps please?
TIA!