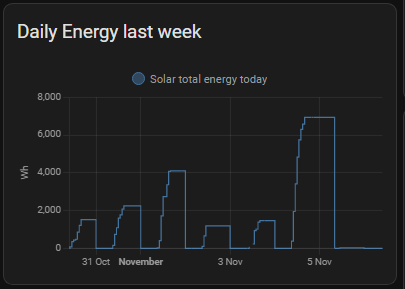
I have some solar thermal and some solar PV installed and I want an “at a glance” comparison of performance over the last week. The Bosch Solar thermal system reports like this:

and I want to overlay the Solar PV on the same graph but it seems incredibly convoluted so I’m probably doing something wrong.
So, from the top; the Power measurement arrives by MQTT and is seen in HA:
unit_of_measurement: W
device_class: power
icon: mdi:sine-wave
friendly_name: Nano33 2 Power
This is filtered for low/noise values by a template entity. (I know I could do this at source but it’s easier for me to edit the YAML than to fire up the Arduino IDE and recompile also it allows me to rename the sensor.
- sensor:
    - name: 'Solar PV Power'
      icon: "mdi:sine-wave"
      unit_of_measurement: W
      device_class: power
      state: >
        {% set Solar_PV_Power = states.sensor.nano33_2_power.state %}
        {%- if Solar_PV_Power|float < 15 -%}
          {% set Solar_PV_Power = 0 %}
        {%- endif -%}
        {{ Solar_PV_Power|float }}
From this value of Power, I want to use a Utility Meter helper to create the daily value, so far I but how do I create meter that counts in Wh and resets daily?