Yes, here please!
Thanks. Looks like the switch over to httpx is working as expected 
1 Like
Running 0.117.0b3 Hassio NUC image.
I wish there was some way to work out what is causing this. 100% use of one core:

(starts at 2am local to home assistant, im in a different timezone. There is nothing in the log or logbook around this time).
It only shows up on the core cpu sensor. The system monitor shows nothing:

Supervisor cpu is fine:

All other addons are fine. I tried restarting them all anyway, but this caused no change.

Top shows nothing:

And we’ve tried profiler and py-spy without success.
Restarting tames the runaway cpu instantly.

Then it happens again a day or three later.
What is the difference between system monitor cpu and core cpu measurements?
It is likely an integration that has a run away thread / loop.
Keeping taking py-spy records each time it happens. Sometimes you have to compare 4 or 5 of them against the idle ones to see the pattern. Make sure to take a py-spy dump as well as it will show the threads.
You may have some luck with strace as well. If you can figure out which thread is running away and attach to it (you can use the py-spy dump output to narrow it down)
Then strace -p <pid> -s 4096 -o trace.log
1 Like
O that’s nice, didn’t realize we could measure per add-on. How do you get all that info per Add-on Tom, is that yet another rest sensor?
also, are those buttons with an embedded mini-graph? If so, could you please share the config of one of them, I would like to try that for sure.
In those situations usually helps me cleaning the browser cache.
In those situation usually helps me flushing the browser cache and browser restart.
No, just standard mini-graph cards.
Is py-spy only recording what is going on in the home assistant container?
Because I don’t think my issue is there.
The system monitor integration does not record an increase in CPU use. Likewise the supervisor and all my addons do not record an increase. It’s only the Core CPU use. Which, I take it, includes host os processes.
So it appears to be something on the host running amok that is reset by the home assistant container restarting. Any idea what that could be?
Unfortunately I have no access to the host for another 4 months until I return home and can share some SSH keys. Though I may be able to get someone to shuffle a USB drive for me before then.
Py-spy is only sampling what is going on in the core python process inside the container.
Yeah, that’s what I thought. Will see if I can get a sneaker-net volunteer to move some SSH keys for me.
Hello,
I’m suffering from high CPU usage too since version 0.117.

I tkink it is related to zwave because my network stops working when it happens and CPU is back to normal when I stop the network.
I did a py-spy for 120 seconds. Here is the svg file.
Can anyone help me ?
Thanks !
Do you have more than core running? It doesn’t look like core is the source of the high cpu from the py-spy.
No, the only process using CPU is HA. Usually CPU is around 5%.

I did 3 snapshots with py-spy:
First one is after a fresh reboot. HA and Zwave are working fine.
Second one after CPU reached 25-26 % and zwave network stopped working.
Third one after stopping zwave network. CPU is back to normal.
Maybe putting the snapshots side by side will show something is wrong ?
By the way I noticed I couldn’t restart zwave after this happened. I get this error:
2020-11-24 06:40:18.684 Error, ERROR: Cannot open serial port /dev/ttyACM0. Error code 6
2020-11-24 06:40:18.684 Error, ERROR: Failed to open serial port /dev/ttyACM0
After rebooting everything is back to normal (until it comes back again after more or less 24 hours).
Edit: seems related to this issue Z-wave stop working after midnight
There isn’t anything interesting in the py-spy recording. Can you do a py-spy top when it happens again?
I think I finally found something. The problem seems to come from the raspberry usb port where the zwave stick is plugged in. The address actually changes from /dev/ttyACM0 to /dev/ttyACM1 which causes the zwave network to stop working in HA. Not sure how it affects the CPU though. Not sure why it mostly happens around midnight either. Anyway I switched the stick to another port and the problem has disappeared since then. Thanks for trying to help.
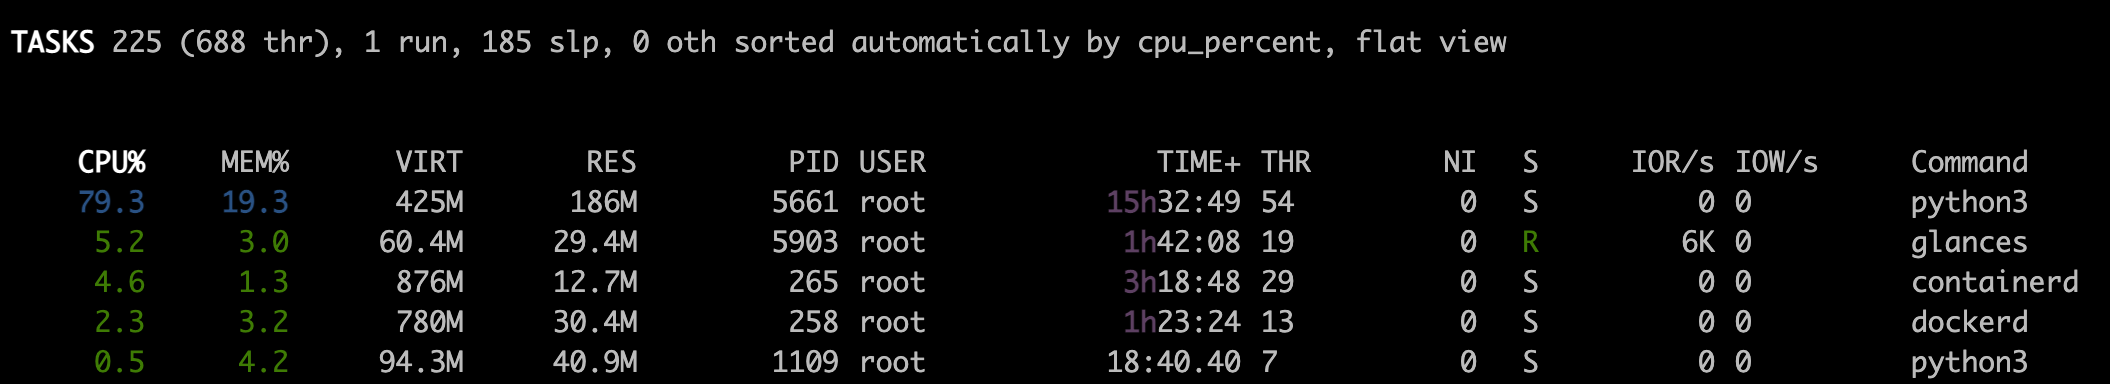
Hi, my i7 PC CPU running the Home Assistant in VM would jump to 100% after a few days just sitting and not doing much. Only restart helps bring it down back to around 1-5% where it usually is, but after a few days it would jump back to 100%, and I have no idea why.
I’m new to py-spy and I would appreciate it if someone would help me out decipher it as I have no idea what I’m looking at.
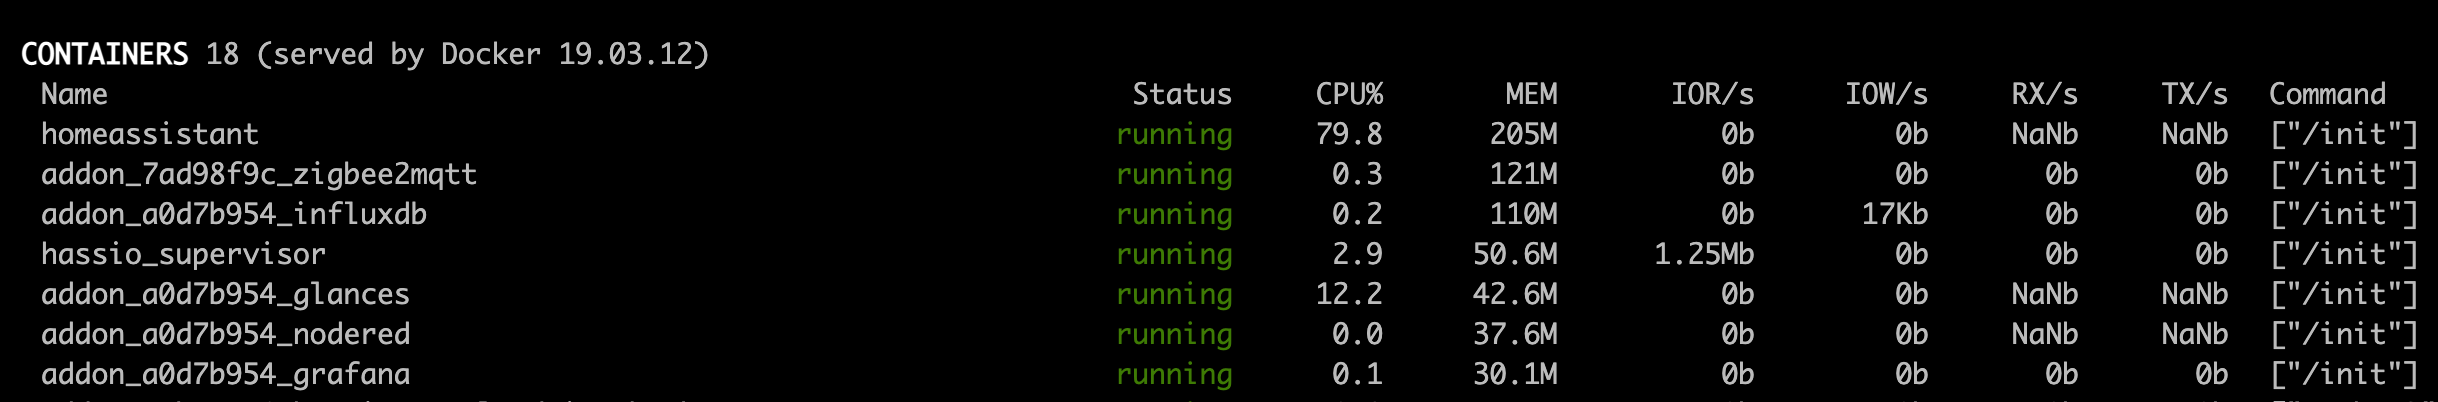
This is the screenshot from Glances where you can see python3 being above 80% all the time.
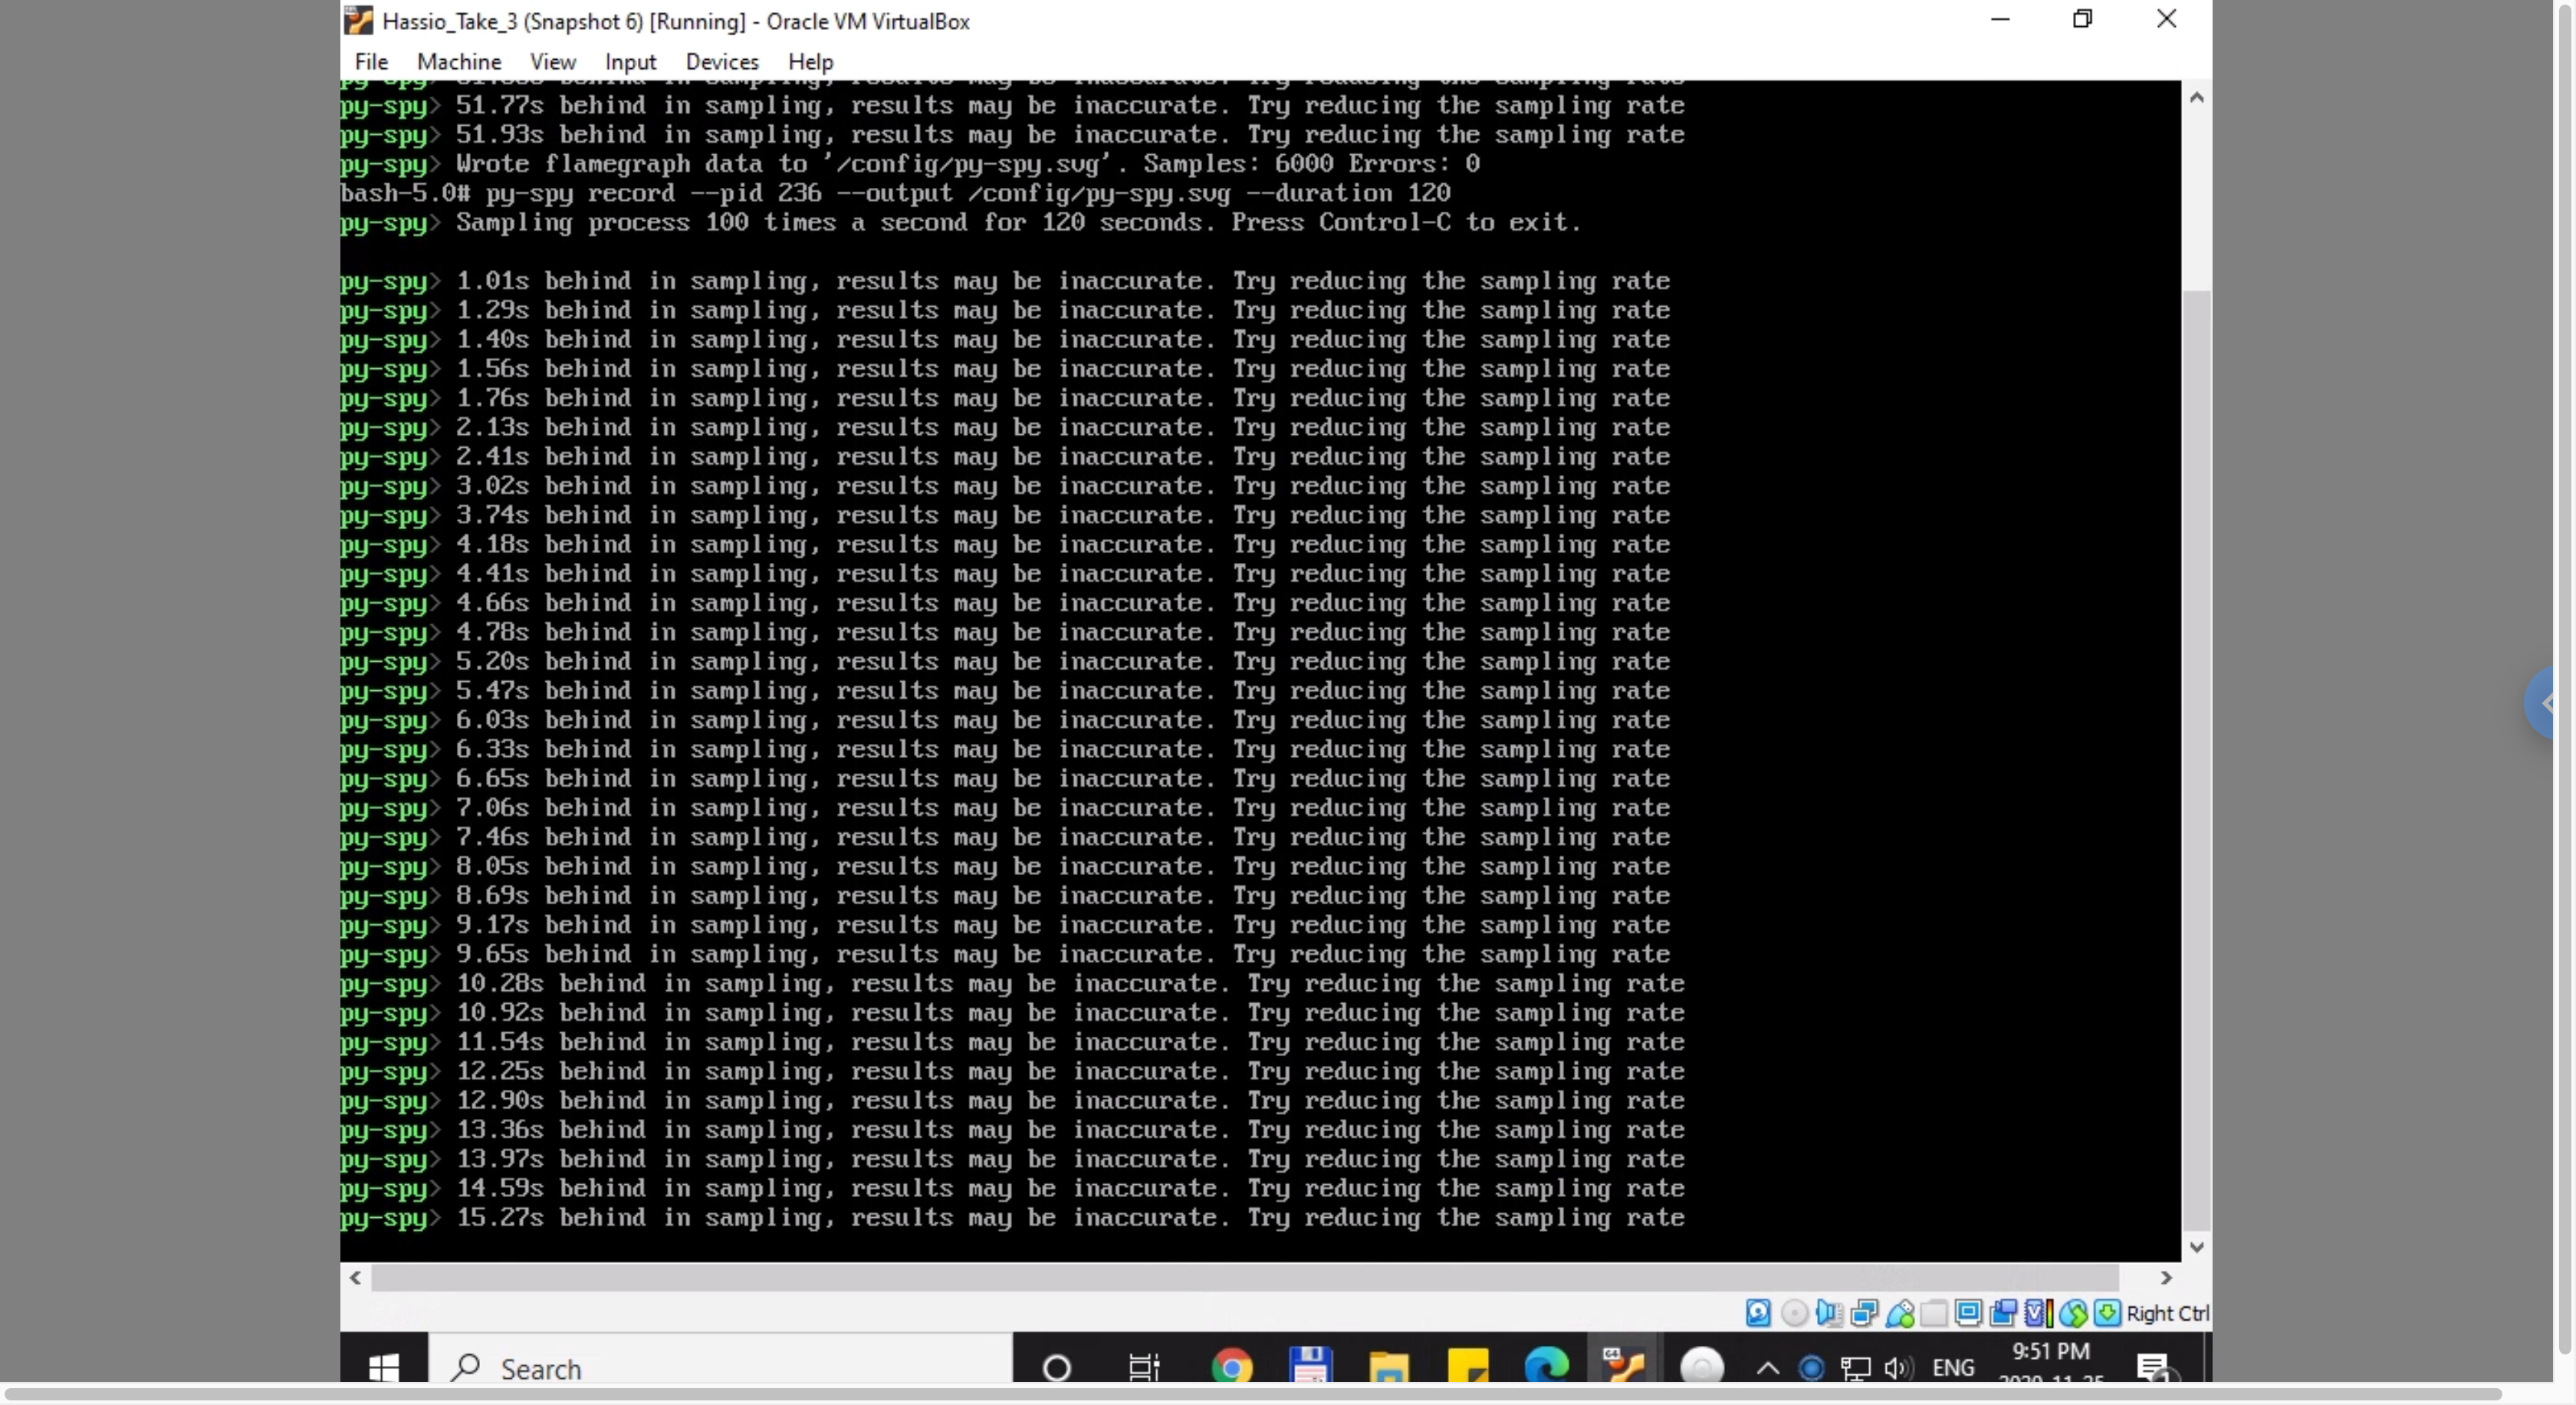
What I noticed during the sampling is that I was getting a message saying sampling is behind and results may be inaccurate. I don’t know what to do to prevent that or if I got valid results.
Would you please post a py-spy dump and top as well.
It looks like the py-spy was only able to sample for very short window so its likely not too useful. You can decrease the rate with --rate
Hi @bdraco, I have restarted the HA so it is acting nicely at the moment. As soon as the CPU jumps up again I will run the py-spy.