Is py-spy only recording what is going on in the home assistant container?
Because I don’t think my issue is there.
The system monitor integration does not record an increase in CPU use. Likewise the supervisor and all my addons do not record an increase. It’s only the Core CPU use. Which, I take it, includes host os processes.
So it appears to be something on the host running amok that is reset by the home assistant container restarting. Any idea what that could be?
Unfortunately I have no access to the host for another 4 months until I return home and can share some SSH keys. Though I may be able to get someone to shuffle a USB drive for me before then.
First one is after a fresh reboot. HA and Zwave are working fine.
Second one after CPU reached 25-26 % and zwave network stopped working.
Third one after stopping zwave network. CPU is back to normal.
Maybe putting the snapshots side by side will show something is wrong ?
By the way I noticed I couldn’t restart zwave after this happened. I get this error:
2020-11-24 06:40:18.684 Error, ERROR: Cannot open serial port /dev/ttyACM0. Error code 6
2020-11-24 06:40:18.684 Error, ERROR: Failed to open serial port /dev/ttyACM0
After rebooting everything is back to normal (until it comes back again after more or less 24 hours).
I think I finally found something. The problem seems to come from the raspberry usb port where the zwave stick is plugged in. The address actually changes from /dev/ttyACM0 to /dev/ttyACM1 which causes the zwave network to stop working in HA. Not sure how it affects the CPU though. Not sure why it mostly happens around midnight either. Anyway I switched the stick to another port and the problem has disappeared since then. Thanks for trying to help.
Hi, my i7 PC CPU running the Home Assistant in VM would jump to 100% after a few days just sitting and not doing much. Only restart helps bring it down back to around 1-5% where it usually is, but after a few days it would jump back to 100%, and I have no idea why.
I’m new to py-spy and I would appreciate it if someone would help me out decipher it as I have no idea what I’m looking at.
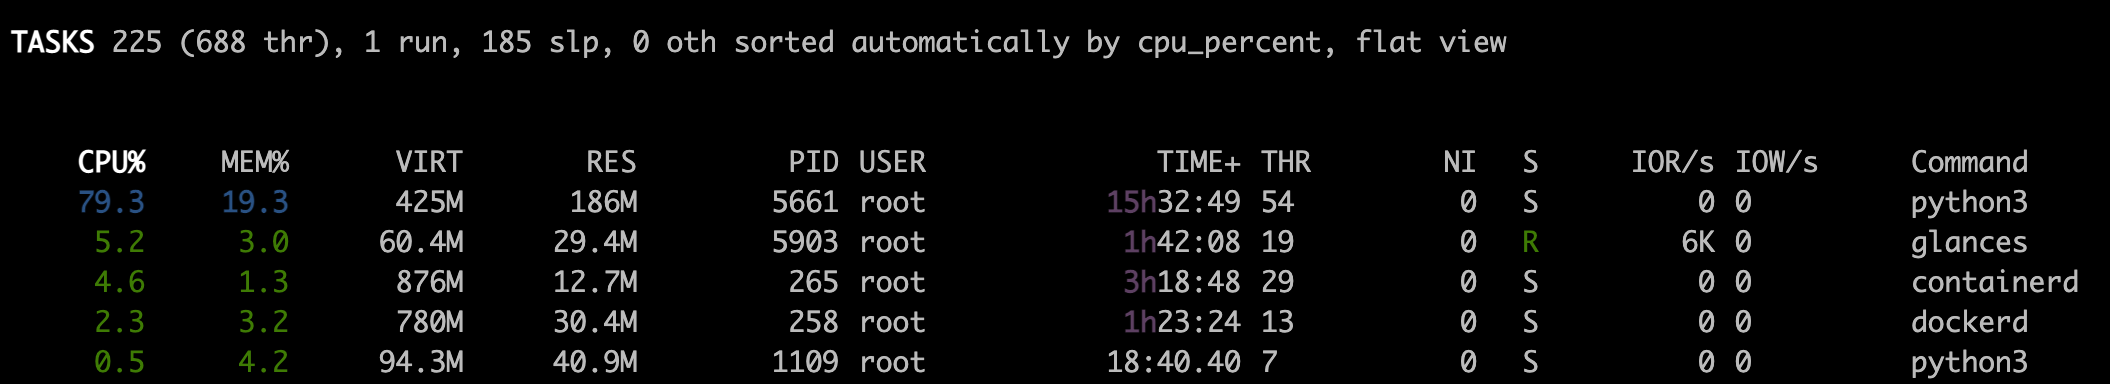
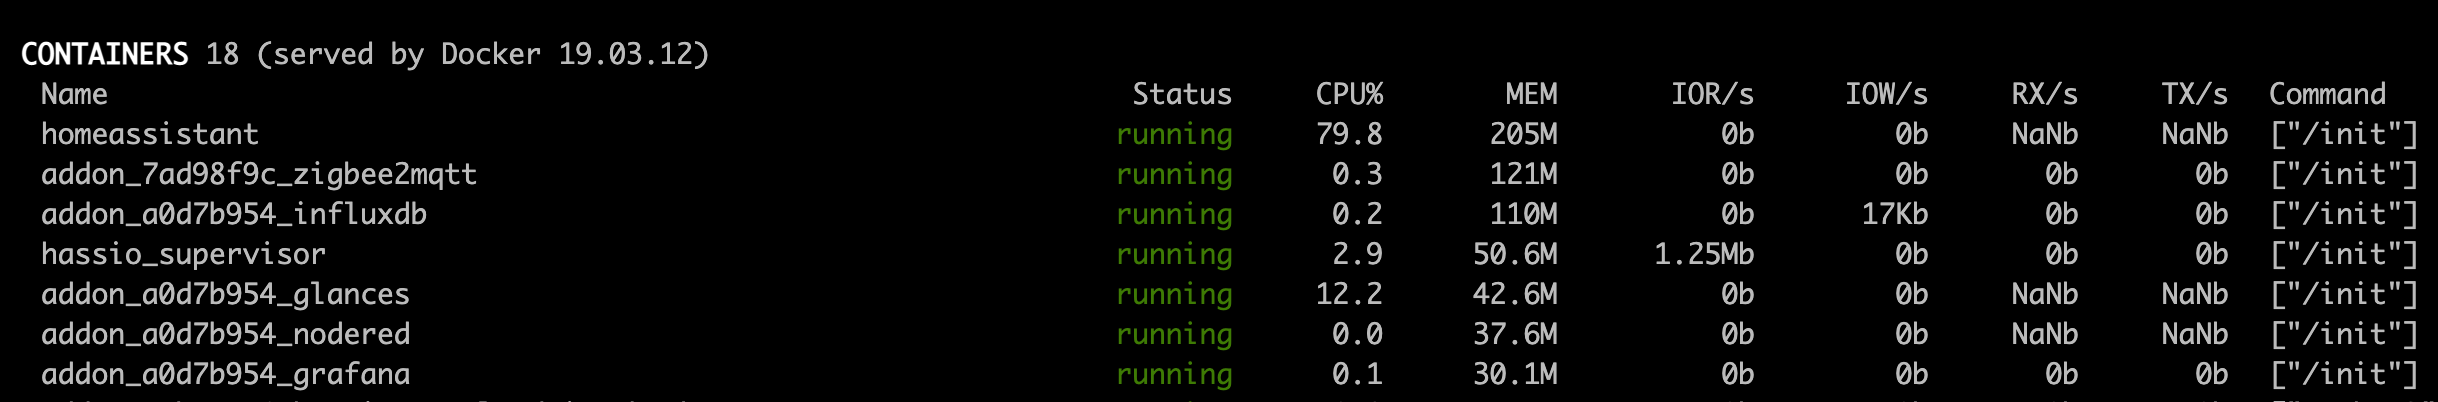
This is the screenshot from Glances where you can see python3 being above 80% all the time.
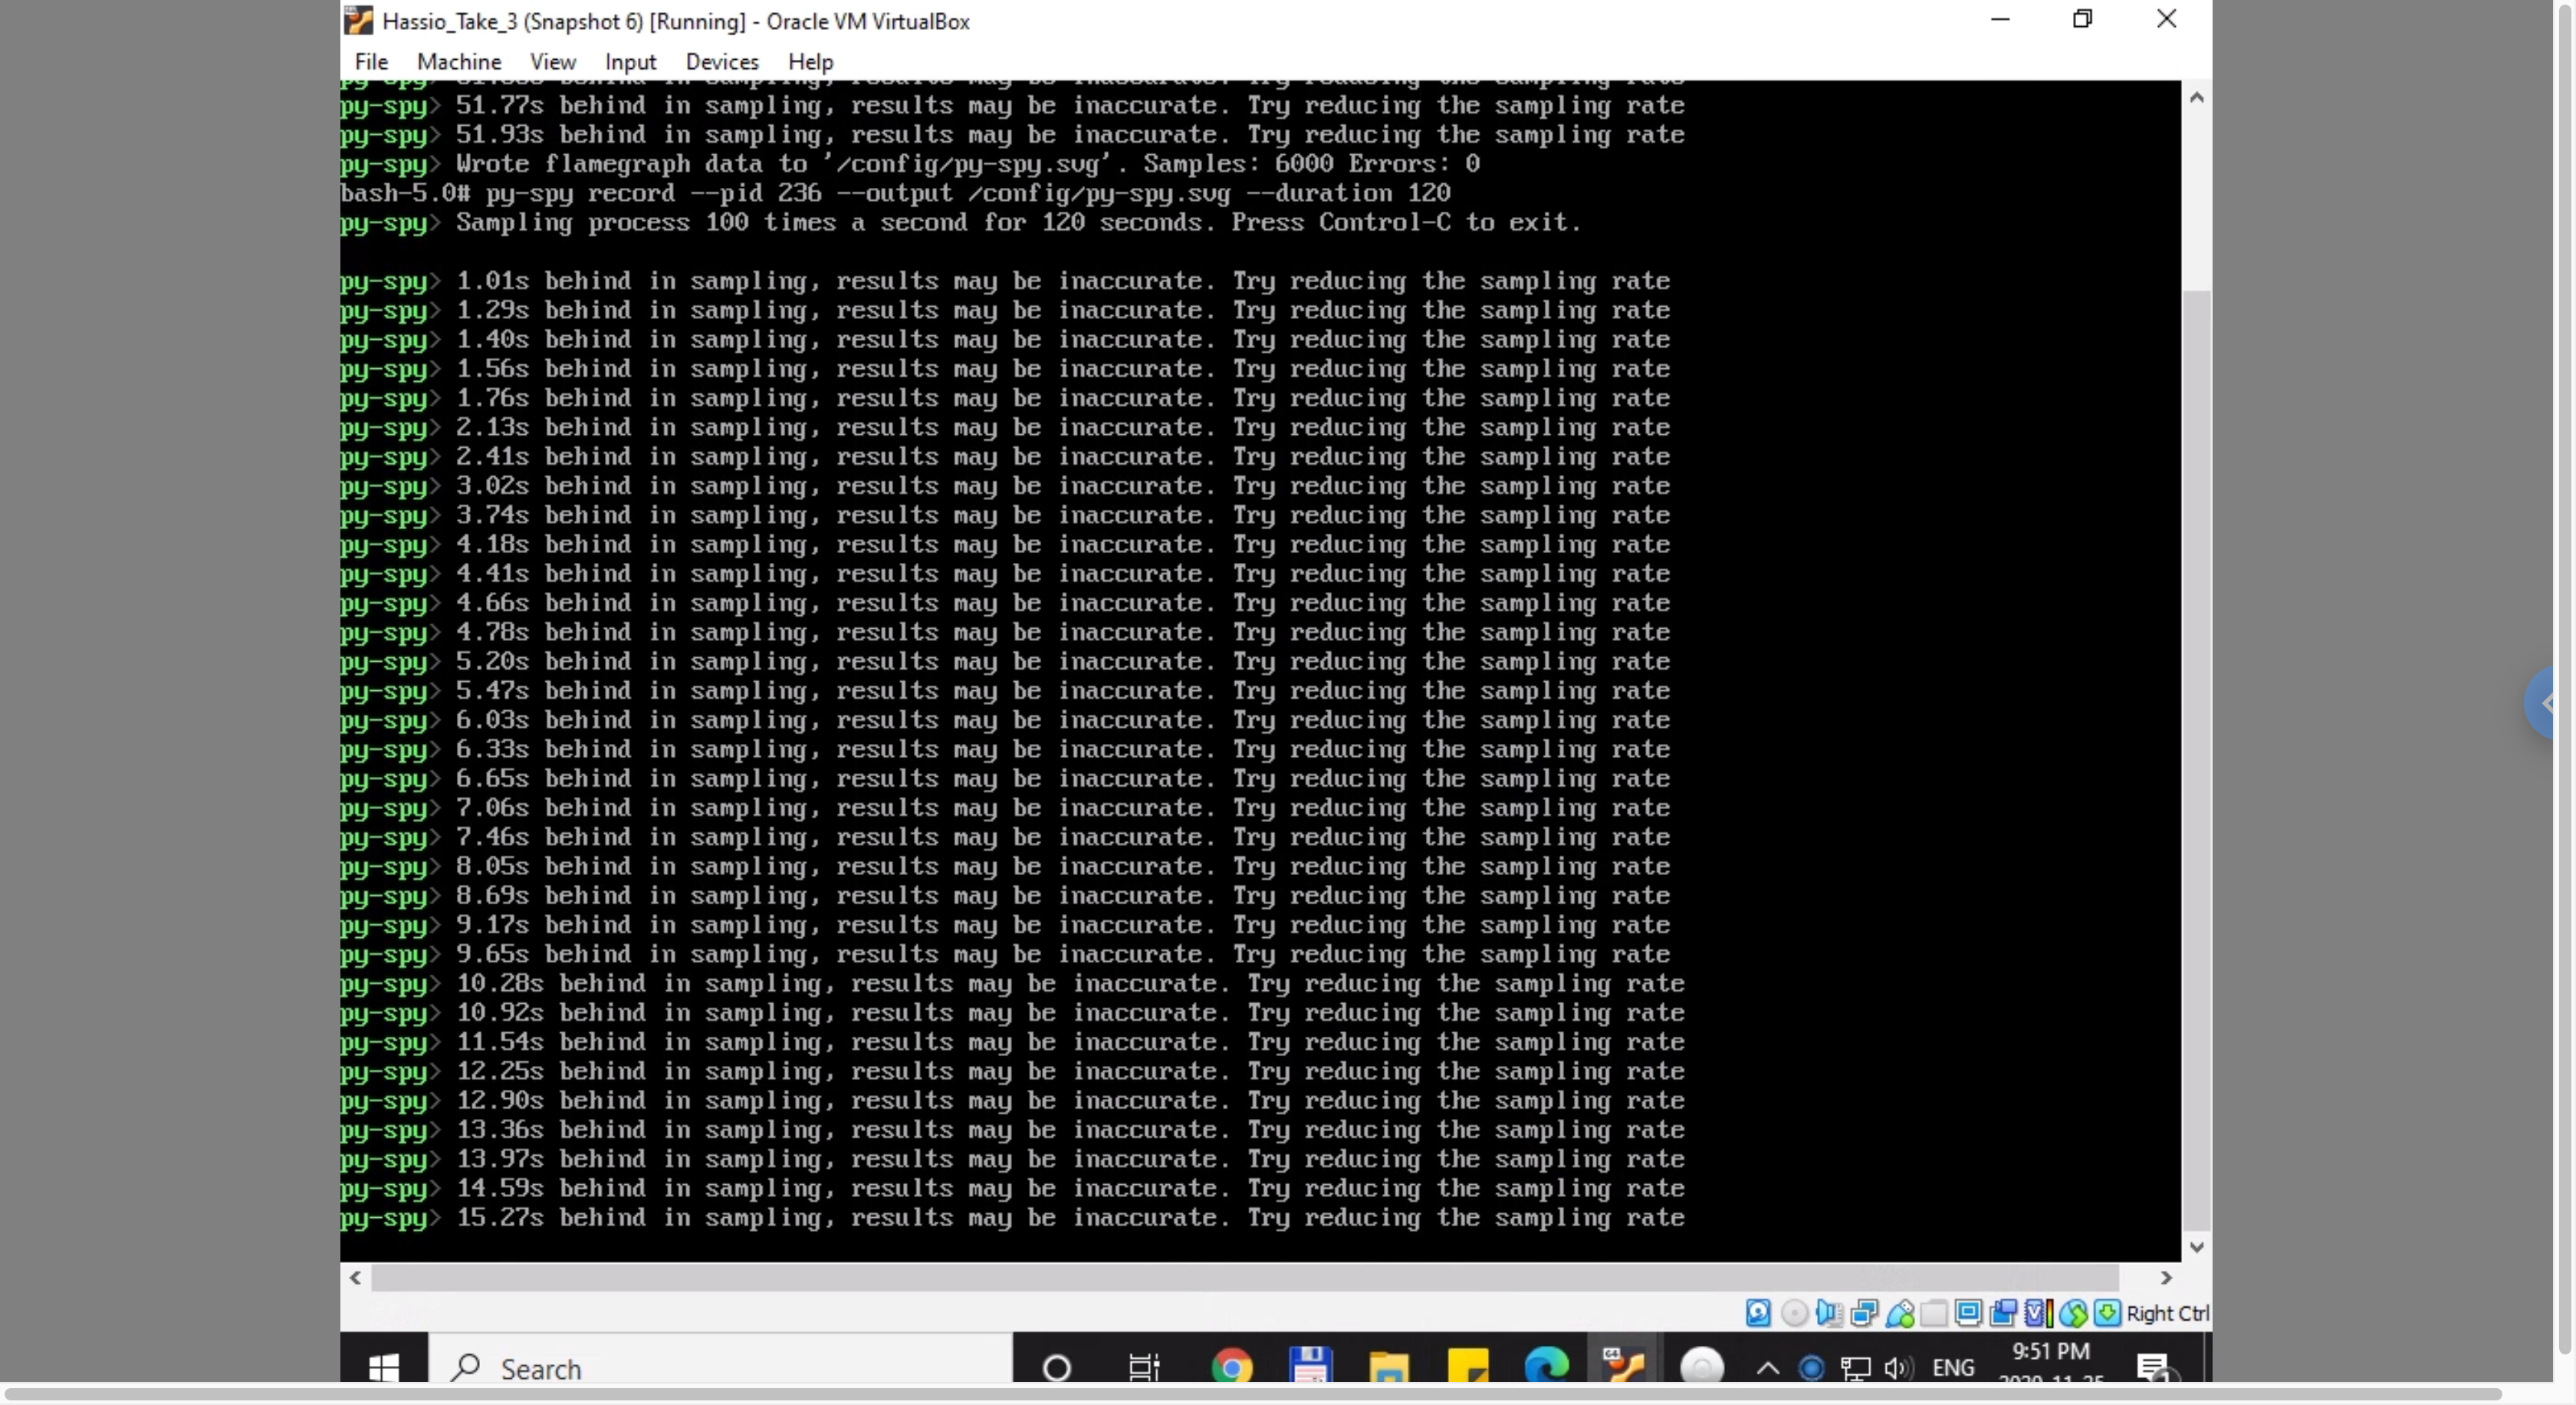
What I noticed during the sampling is that I was getting a message saying sampling is behind and results may be inaccurate. I don’t know what to do to prevent that or if I got valid results.
Can you help me out please a little bit. When turning off a script (called by an automation) my CPU usage jumps up to 100% and the HA is becoming unresponsive. Here is the automation and the scripts https://pastebin.com/MsBA1KCy
I have run the Profiler integration and as a result I have 2 files what I have opened but cannot interpret them. https://we.tl/t-M6CNmSVUjA
Can somebody help with them? Thank you.
I am having similar issue with core cpu usage going up during certain hours (usually from 6:30 until 16:30sh) then it goes back to normal 6-8 % during the rest of the day. I disabled all addons and removed everything from my config and still get the same issue. in Glances it shows paython3 is at ~300 CPU%. @bdraco I emailed you the profiler files hoping that you can take a look at it and figure out the cause of the high cpu usage so it can be fixed in future update.
The profile seems to show it is spending most of the time on the unifi integration device_tracker. There were 1686 device tracker state changes during the profile (which I assume was 60 seconds)
Then after that I tried to run PySpy but it was no longer installed. Possibly due to an update so I reinstalled it following finity’s post above. It warned about an outdated dependency but I ran it anyway…
…which crashed the home assistant container requiring a ha core restart via SSH, which has promptly brought the CPU use under control again.
It looks like profiler completed. SVG in the zip file linked above.