I think I finally found something. The problem seems to come from the raspberry usb port where the zwave stick is plugged in. The address actually changes from /dev/ttyACM0 to /dev/ttyACM1 which causes the zwave network to stop working in HA. Not sure how it affects the CPU though. Not sure why it mostly happens around midnight either. Anyway I switched the stick to another port and the problem has disappeared since then. Thanks for trying to help.
Hi, my i7 PC CPU running the Home Assistant in VM would jump to 100% after a few days just sitting and not doing much. Only restart helps bring it down back to around 1-5% where it usually is, but after a few days it would jump back to 100%, and I have no idea why.
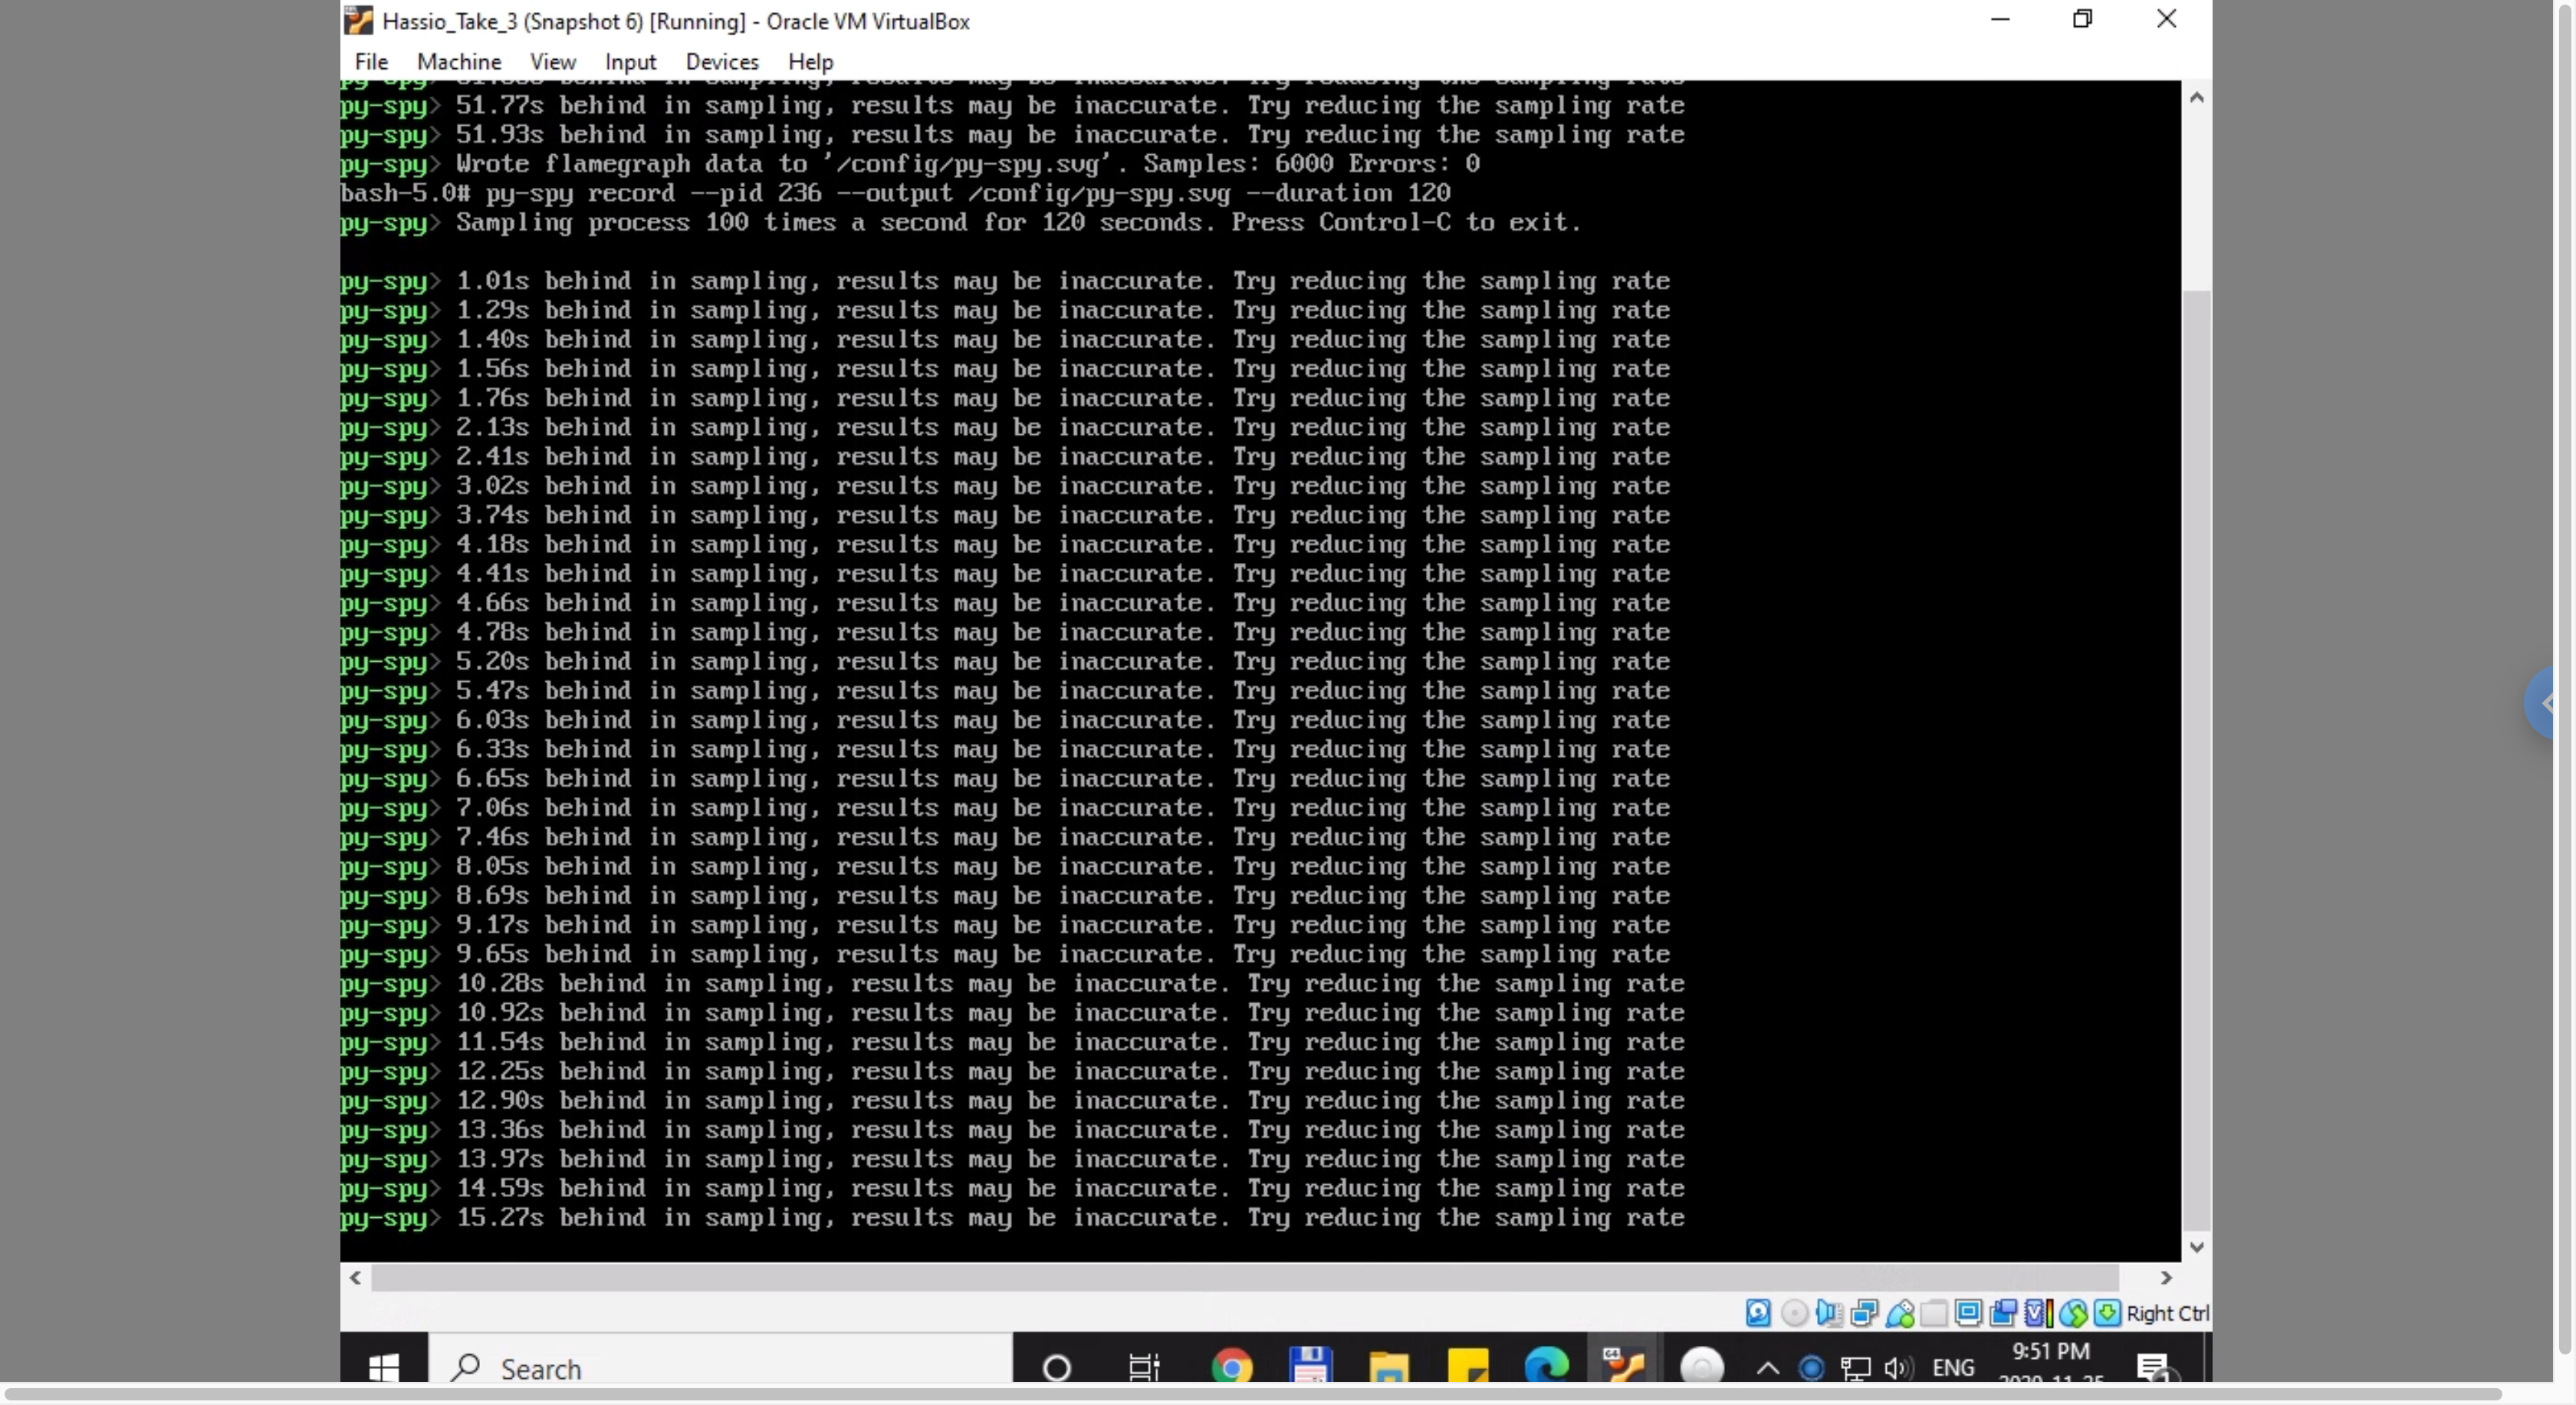
I’m new to py-spy and I would appreciate it if someone would help me out decipher it as I have no idea what I’m looking at.
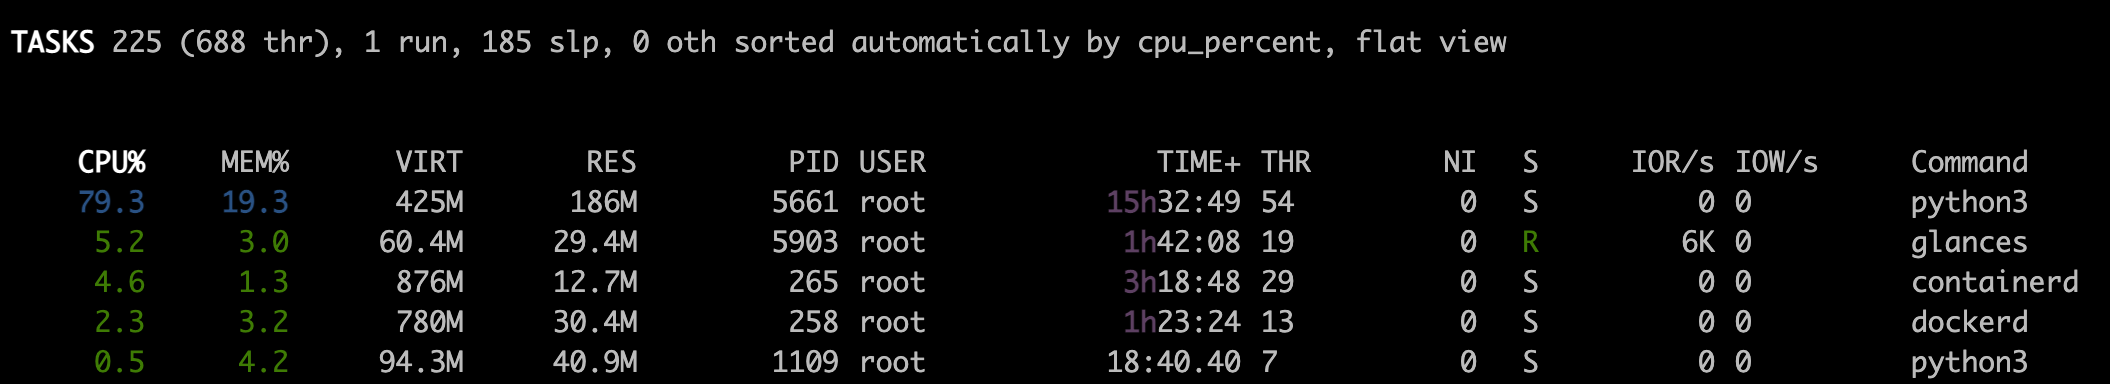
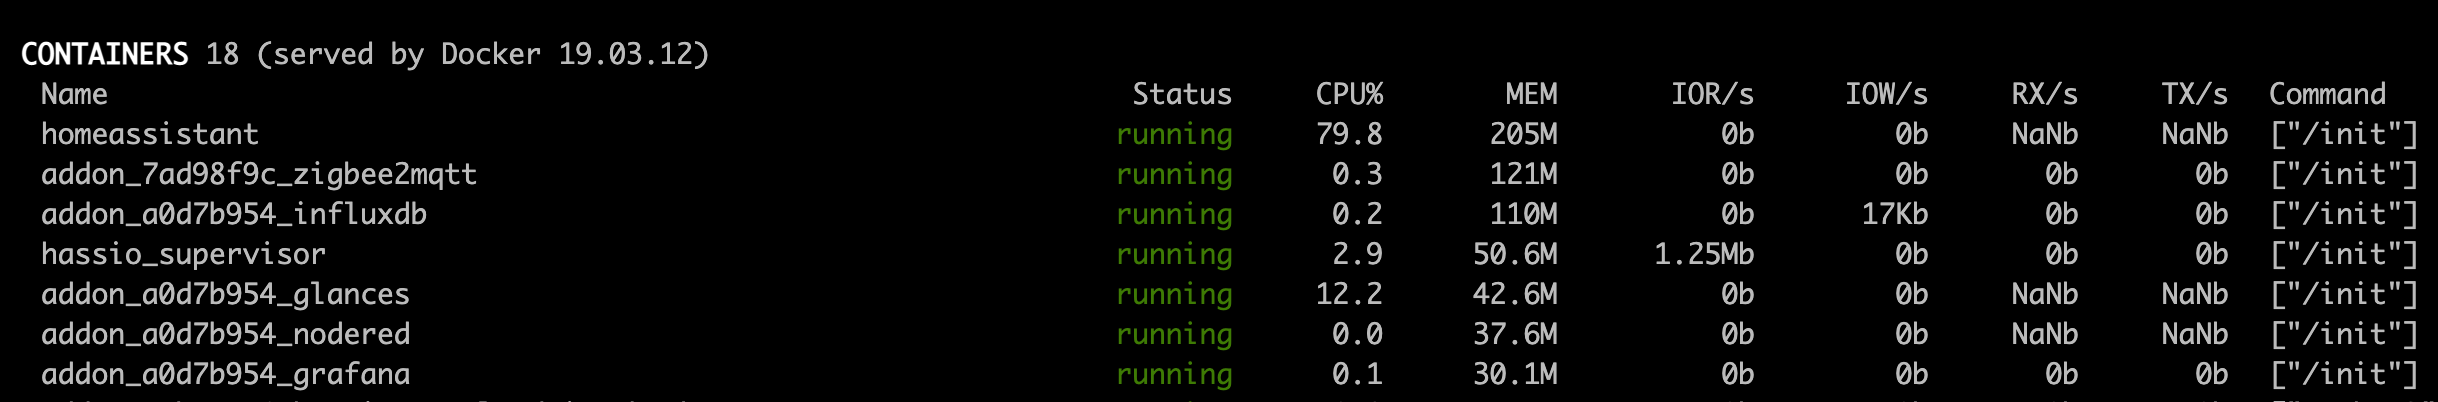
This is the screenshot from Glances where you can see python3 being above 80% all the time.
What I noticed during the sampling is that I was getting a message saying sampling is behind and results may be inaccurate. I don’t know what to do to prevent that or if I got valid results.
Would you please post a py-spy dump and top as well.
It looks like the py-spy was only able to sample for very short window so its likely not too useful. You can decrease the rate with --rate
Hi @bdraco, I have restarted the HA so it is acting nicely at the moment. As soon as the CPU jumps up again I will run the py-spy.
Can you help me out please a little bit. When turning off a script (called by an automation) my CPU usage jumps up to 100% and the HA is becoming unresponsive. Here is the automation and the scripts https://pastebin.com/MsBA1KCy
I have run the Profiler integration and as a result I have 2 files what I have opened but cannot interpret them. https://we.tl/t-M6CNmSVUjA
Can somebody help with them? Thank you.
Did you have any success on this? What´s your current status? I´m in a similar situation (HASS OS becomes unresponsive / then almost unusable / and is finally dead - starting every ~ 10 hours after last HA start) even it´s not yet clear Python is the root cause. Anyway, your problem is 30 days old… hope to get some input.
I am having similar issue with core cpu usage going up during certain hours (usually from 6:30 until 16:30sh) then it goes back to normal 6-8 % during the rest of the day. I disabled all addons and removed everything from my config and still get the same issue. in Glances it shows paython3 is at ~300 CPU%.
@bdraco I emailed you the profiler files hoping that you can take a look at it and figure out the cause of the high cpu usage so it can be fixed in future update.
Thank you

I didn’t see an email from you (may have been filtered). Feel free to PM instead.
The profile seems to show it is spending most of the time on the unifi integration device_tracker. There were 1686 device tracker state changes during the profile (which I assume was 60 seconds)
After doing the following it seems like my issue was resolved:
1- Disabled the stream component.
2- Unchecked the preload stream option from all my cameras.
3- Added the following lines to my config file:
logger:

  default: info

  logs:

    homeassistant.components.camera: critical

    homeassistant.components.generic.camera: critical

    libav.NULL: critical

The update to 2021.1 has made things worse than ever.

That’s 100% of one of four cores in continuous use.
I ran profiler. Output available here.
Then after that I tried to run PySpy but it was no longer installed. Possibly due to an update so I reinstalled it following finity’s post above. It warned about an outdated dependency but I ran it anyway…
…which crashed the home assistant container requiring a ha core restart via SSH, which has promptly brought the CPU use under control again.
It looks like profiler completed. SVG in the zip file linked above.
Okay. I think I’m getting to the bottom of this.
I have quite few API calls like this to montor addon and system metrics:
- platform: rest
  resource: https://homeassistant:8123/api/hassio/addons/core_mariadb/stats
  name: MariaDB CPU
  unit_of_measurement: '%'
  value_template: '{{ (value_json.data.cpu_percent|float)|round(2) }}'
  scan_interval: 60
  verify_ssl: false
  headers:
    Authorization: !secret ha_api_token
    Content-Type: application/json
  json_attributes_path: "$.data"
  json_attributes:
    - memory_percent
After giving them all prime number scan intervals my core CPU usage has stabilised to this use pattern:

Expanded:

@bdraco these API calls seem to be quite CPU intensive. Is there anything that can be done to optimise them?
Too much monitoring kills monitoring ! 
2 Likes
To be honest the addon monitoring has never shown an issue.

If there is no way to reduce the impact of this monitoring I’ll probably delete the sensors and view, (and then 3 months later I’ll need it to diagnose an issue).
1 Like
These look like they are expensive on the supervisor or operating system side. Unfortunately that is a bit outside of what I can help with as I generally only work on core and frontend and don’t have the same level of insight into the other code bases.
1 Like
No problem. Thanks for letting me know.
I’ve tried about every option I could find and can’t get py-spy installed.
On Rpi4 with HAOS the only way to do it seemed with precompiled binary but getting:
ERROR: py_spy-0.3.4-py2.py3-none-manylinux2014_aarch64.whl is not a supported wheel on this platform.
Then tried to do it with cargo but that also fails halfway through compiling with
error: failed to run custom build command for `syn v1.0.61`

Caused by:
  could not execute process `/tmp/cargo-installBNVoFA/release/build/syn-a31747dac66b12a2/build-script-buil                                                           d` (never executed)

Caused by:
  Permission denied (os error 13)
warning: build failed, waiting for other jobs to finish...
error: failed to compile `py-spy v0.3.3`, intermediate artifacts can be found at `/tmp/cargo-installBNVoFA`

Caused by:
  build failed
Please see post #74
Ah I was reading through all of that yesterday and completely missed it. In my case I’m getting RAM increasing linearly from baseline till it maxes out and container dies off till it restarts. Would this work for RAM too?
If the cause of the issue is also a cpu hog then it might show it. They tend to be related so there is a good chance it will help point you in the right direction.