QCells Q.Home energy dashboard questions

Thanks for the tip, that would make the results even more accurate. Do you have any suggestions of which hardware to get for that?

Have a look in the Wiki Home · wills106/homeassistant-solax-modbus Wiki · GitHub there are links for the RS485 Adaptor and installation notes. Just follow along with the SolaX Gen4 as that’s what your Inverter is.

1 Like

Thanks, will do!

If you want to go the COM Port way, just do it. To be honest, working with cables, creating own ethernet ports and screwing things in and out of a inverter scares me to death.

If there does exist a working AIO device - COM-Port, matching two cables for my inverter (H34B model) pre-assembled, LAN-Port ready to fit into a switch - I would pay for it.

If you want to go the QCells/Solax Cloud way, just tell me.

I would very much prefer the cloud way, at LEAST for the beginning. These COM-Ethernet boxes seem to be more of a testing-environment and not cheap as I found out :slight_smile: So - any of your help still very much appreciated. 5 min accuracy is not too bad to beginn with :wink:

Ok.

1.) Do you know where the main directory of the HA software is located on your system? This directory does contain files like “automations.yaml” and/or “configuration.yaml”.

2.) Do you know how to manipulate files on your system?

If yes to both:

1.) Make a backup of the “configuration.yaml” file and a backup of the “secrets.yaml” file (if it already exists). With these copies you can always go back to the current state of HA. Just copy the backup files over the manipulated files in case of emergency.

2.) Start with the creation/manipulation of a file called “secrets.yaml”. If it does exist already, just change it - else create an empty file. Append the contents marked as “secrets.yaml” from my first post into that file and change the URL to the URL that does work for you. Save the “secrets.yaml” file.

3.) Look into the file called “configuration.yaml”. Is there somewhere a line with the text “sensor:” starting at the very first column?

3a.) If not: Copy the complete content marked as “configuration.yaml” from my first post into that file right above the first line at the bottom containing the text “!include”.

3b.) If the text “sensor:” does exist at the very first column somewhere in your “configuration.yaml”: Copy the complete content marked as “configuration.yaml” from my first post below that line starting with “sensor:” at the very first column. You need to leave out the first line containing “sensor:” from my contents in that case.

3c.) In my code you’ll find a calculation that starts with “8300 * 0.9”. 8300 represents the usable W of my three Q-Save Batteries. Depending on your installation you need to change that to 5500, 8300 or 11000:

4.) Navigate in your HA to the menu entry “Entwicklerwerkzeuge”. Under the Tab “YAML” you’ll see a link “Konfiguration prüfen”. Hit that. It will output “Success” in green or “Failure” in red.

On “failure” we need to investigate the error. Please post the error message here. Remember: You can always go back with your backup files.


5.) Only on success!!! Restart HA. It’s the link on the right “Neu starten”.

After the restart you should see the QCells sensors on “Einstellungen → Geräte & Dienste → Entitäten”. Filter for QCells and they will appear. Give them at least 5 minutes to show values on their “Info” tabs because five minutes is the intervall to fetch data from the QCells cloud.

6.) Now we need to add 5 (five) “Helpers” (Einstellungen → Geräte & Dienste → Helfer) of type “Integration - RiemannIntegralSensor”. The five sensors you need to create these Helpers for are:

QCells Cloud Battery Charge
QCells Cloud Battery Discharge
QCells Cloud Grid Feed
QCells Cloud Grid Load
QCells Inverter DC PV power sum

Simply add " kh" to the Helper Names in these five dialog, choose “left”, “2 digits”, “Kilo” and “Hour” as parameters always.

Create them as follows (example on QCells Cloud Battery Charge):

At the end it looks like that:

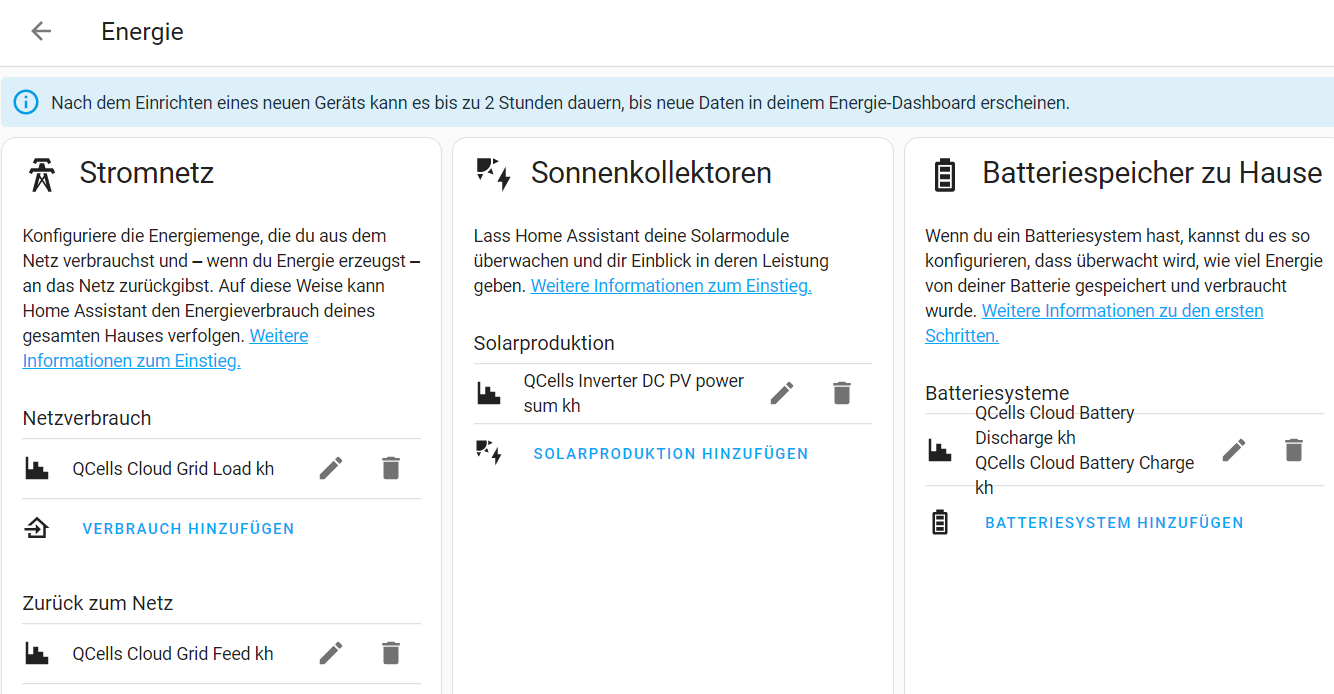
After that everything is working. Hit “Einstellungen → Dashboards ->Energy”. Here you can add the Helpers (those with the trailing “kh”) to “QCells Cloud Battery Charge kh”, “QCells Cloud Battery Discharge kh” in the Battery section. In addition add the “QCells Inverter DC PV power sum kh” to the Solar section. If you’ve setup a weather card, simply add that as solar forecast.

Now we are hitting a point where you need to decide if you want to track cost and income. If you want - look at this example for cost and income:

template:  
  - sensor:
    - name: "Strompreis"
      unit_of_measurement: "EUR/kWh"
      icon: mdi:currency-eur
      state: >
        {% if now().strftime("%Y%m%d") >= "20230101" %}
          {{ 0.5498 }}
        {% elif now().strftime("%Y%m%d") >= "20220801" %}
          {{ 0.305 }}
        {% elif now().strftime("%Y%m%d") >= "20220701" %}
          {{ 0.2371 }}
        {% elif now().strftime("%Y%m%d") >= "20200401" %}
          {{ 0.2814 }}
        {% elif now().strftime("%Y%m%d") >= "20190401" %}
          {{ 0.2582 }}
        {% else %}
          {{ 0 }}
        {% endif %}

  - sensor:
    - name: "Einspeisevergütung Strom"
      unit_of_measurement: "EUR/kWh"
      icon: mdi:currency-eur
      state: >
        {% if now().strftime("%Y%m%d") >= "20190604" %}
          {{ 0.1095 }}
        {% else %}
          {{ 0 }}
        {% endif %}

If you don’t want to track cost and income simply add “QCells Cloud Grid Feed” as “Zurück ins Netz” and “QCells Cloud Grid Load” as “Netzverbrauch” in the Energy Dashboard settings. It looks like that then:

I you want, you can now add additional cards of your choice everywhere ony your dashboards for these sensors (this time without the trailing “kh”):

QCells Inverter DC PV power sum → current Solar production (W)
QCells BMS energy SOC → current battery level (%)
QCells Inverter DC Battery power total → what’s going in or out of battery (W, +/-)
QCells Grid power total → what’s going in or out from/to the net (W, +/-)
QCells Cloud House Load → load of your home (W)
QCells Cloud Solar plus Battery total → total of current solar production and battery capacity
… and a lot more

4 Likes

Wow!!! Thank you so much for your efforts … really much appreciated. I will go through this step by step tonight or tomorrow at the latest and provide feedback. THANKS! so far.

Yeah, I guess you’ll need to print my two posts :wink:

I absolutely did :slight_smile: Thank you again for this massive post - it worked flawlessly!!! I got it up and running. For everybody trying to follow this great guide as well, just one hint: You (obviously) cannot add the helpers to the “Energy-dashboard” unless they received their first data from the cloud. In my case I cannot add the helpers for “battery discharge” and “grid load” just because I am not using my battery at the moment and I am not receiving energy from the grid (meaning I am producing enough with my panels at the moment).

REALLY appreciate the help! Thanks again!

Glad it worked for you.

One thought: I’m not pretty sure if you should keep that battery sensors then in “configuration.yaml”. I did “default” most of the data to “0”. That means they will work - but produce “0”. If you keep these sensors and you add the battery later I have no idea how that changes the meaning of values.

So if you don’t have batteries ATM, I would comment (“#” in the first column) these complete blocks:

qcells_cloud_battery_charge:
qcells_cloud_battery_discharge:
qcells_cloud_battery_usable:
qcells_cloud_solar_plus_battery_total:

I wrote that massive post to keep that knowledge for me and others.

1 Like

Dear welcomeha,

Thanks for spending a lot of time writing this post. I followed your explanations to a point where I get the sensor data of my PV system from the cloud. It would be great if you also could share the configuration behind your graphs like “Energieverbrauch” and “Energieverteilung”. Your dashboards are in a perfect shape. Not sure if there is also a yaml that describes the configurations, or if they have to be build using a graphical interface ? Any additional hints about the visualisation are very much appreciated…

best regards,
Harald

This is not from me. If you add the correct entities to the “Energy Dashboard” (shown above) they are presented by HA itself.

Hello,

first of all I would like to thank you for your great work and the detailed instructions! It was very helpful for me!

I have now built everything into my Homeassitant and get the data from the cloud.

Unfortunately, I have a problem with the values when the cloud is not available for a short time. Zero values are then always saved which break my graphs. Do you have an idea how to solve this? It would be sufficient for me if no measuring point is generated at all when the cloud is not available.

Hello,
Thank you for the great explanation, it works perfectly. Unfortunately I can’t manage to use the Qcells values in an automation. For example, I would like to switch on a pool pump automatically at 8.00 a.m. when the battery is still more than 40% charged. You can select an entity, but nothing happens at 8:00 a.m. I would be very grateful for a tip.

Sorry for the delay. This is easy - use a numeric state trigger:

platform: numeric_state
entity_id: sensor.qcells_cloud_solar_plus_battery_total
above: sensor.qcells_cloud_house_load <-- This is a input number helper
for:
  hours: 0
  minutes: 5
  seconds: 0

Uah, this is way beyond my knowledge. The only time the Cloud is not available to me is when there’s an update of the cloud. That happened 2-3 times in the last six months. Why do you have so many problems with the cloud availability?

Did you ever check if there is a problem with your internet connection? Might be related to your internet service provider or router.

Very helpful explanation. Thank you.
Where do you put the template for the Strompreis? I could not find a place in the UI, which does not allow this complex structure. Is the place in ./config/.storage/energy ? And how do I activate it?
Thank you

Yes I have checked the connection and cannot find any problems. However, I have experimented a little with the timeout and the scan interval. I now let the home assistant ask for new values every 60 seconds and allow a timeout of up to 180 seconds. This is still not optimal, but since then my graphs look better.

# Q-Save 9.1 --> 8300W usable minus 10% minimum load multiplied by soc
# E.g. 35% soc --> 2614.5 W
      qcells_cloud_battery_usable:
        friendly_name: QCells Cloud Battery usable
        value_template: "{{ 8300 * 0.9 * (max(states('sensor.qcells_cloud_soc') | float(default=0) - 10, 0) / 100) }}"
        unit_of_measurement: W
        device_class: power

Is it possible that your code deducts the 10% twice?

In your example Homeassitant calculates 8300x0,9x0,9x0,35=2353,05W :frowning: