Randomly missing data in DB (internal SQlite & influxdb)

Hello all,

I am running Hassio in VirtualBox for several days (influxdb+grafana). Everything works great except the problem with database, where the data are stored.
For now I am using esphome with DHT22 and systemmonitor. All these data are saved into DB.
But the problem is that some periods of data are missing (randomly).

As you can see on picture below, the data from “Outdoor” esphome sensor are saved correctly, but the “North Room” node has problem with saving the humidity. I looked into Hassio DB via SQLite Web and data here are also missing.

I thought that maybe there is bad connection with esphome, so I looked on the log in the node and the device is sending data correctly (and it has good wifi signal too). I would post image, but as newbie I can post only one…

Also I looked on the systemmonitor graph (I am monitoring system resources) which is pretty much internal sensor, so there is no interference with wireless transfer and there are also missing data (mostly for disk usage - total blackout). I would post image, but as newbie I can post only one…

Also I looked into the logs and there are no errors or warnings. So what is happening?
Please, can somebody help me? I am not very good with Linux, so I will appreciate step by step instructions.

Thank you in advance!

Anubis

1 Like

Did you ever solve this? I have have an esp32 connected to a DHT11. I read the sensor via mqtt and program it through esphome.

I notice that when I subscribe to the topic in HA NOde Red I see messages at 1 minutes intervals as programmed. However, when I look at influx ever so often I loose samples…I would say regularly. Nothing in HA logs and esphome says its sending every minutes at the mode red debug monitor confirms.

Sounds like your issue? I don’t save data to my recorder data fro sensors but from your post it looks like it would likely not be there either. Did you ever figure out how to troubleshoot this?

I’m encountering the same problem. I’m running Home Assisant on a Pi (with SSD), with InfluxDB, and randomly missing (a lot of) data points, both from an esphome sensor, as wel as from the smart meter (connected via USB). Does anyone know what could be the cause, and how to fix this?

I see this as well with some of my zigbee sensors, so it does not seem to be integration dependent.

Ok, I started troubleshooting. Until now I’ve tried the following, without success (still randomly losing data):

  • use MariaDB instead of the default database
  • exclude all DSMR data from the recorder
  • only included limited amount of sensors in influxDB
  • switching off DSMR (by disabling in configuration.yaml)
  • long term CPU/system load is 0.2-0.3

I’m running up-to-date versions of home assisant, influxdb, etc
Raspberry Pi 3B
256GB 2.5" SSD on USB (HA boots from it)
Very limited amout of sensors connected:

  • DSMR v5 via P1 cable
  • One sensor on ESPHome, sending 3 values (T,rH,P) every minute. Checking the logs from the sensor, the sensor is sending the data. However, especially the Temp value is lost more then that it is recorded.

Does anyone have a clue what could be going on?

Is anyone able to help?

With 2 T/rH/P sensors connected, both show approximately the same: temperature values are missing more often than rH, P is somewhere in between.

If the temperature does not change, it will not be recorded.

1 Like

I understand, however I see huge jumps in temperature with large time gaps (just like in the Humidity in the images of the topicstarter Anubis). I’m convinced this is not because of the temperature changing suddenly, but because of data not coming trough in some way.

Any news on this topic? Obviously, at least in my installation there is a data point in influx db but its empty.

This is how the cdv-output looks like

2020-11-24T07:48:00.000Z,“klimaanlage_leistung_gastehaus”
2020-11-24T07:50:00.000Z,“klimaanlage_leistung_gastehaus”
2020-11-24T07:52:00.000Z,“klimaanlage_leistung_gastehaus”
2020-11-24T07:54:00.000Z,“klimaanlage_leistung_gastehaus”
2020-11-24T07:56:00.000Z,“3.0999999046325684”,“klimaanlage_leistung_gastehaus”
2020-11-24T07:58:00.000Z,“klimaanlage_leistung_gastehaus”
2020-11-24T08:00:00.000Z,“klimaanlage_leistung_gastehaus”

The sensor is a knx based. Its sending at least every 30 minutes an update.

In my case, after looking again to the data with his remark, francisp was right. It had to do with:

  • when the value did not change, it is not recorded
  • when the temperature/humidity is pretty table, the scale of the graphs is getting smaller: a small change seems huge
  • the way influxdb by default “bridges” the gap between 2 datapoints: drawing a diagonal line instead of keeping the line horizontal until the actual change is recorded. (This can be changed in influxdb: change “fill” from “null” to “previous”)
1 Like

Thanks for the reply. Obviously this is not the case here i guess.
The KNX-Sensor is sending slightly different values(e.g. approx. 3.1 W, than 3.7 W)

Same problem, Irony is i am picking up 2 sensor values from the same MQTT topic. One of them is sending all data to influx but the other one is sending randomly every now and then.

Moved to Node Red for persisting my sensor data to influx, works perfect for months.

Node Red listend to the MQTT topics (my Sensor all run in MQTT, be it zigbee, zwave or 433mhz) for that, so no HA dependence.

1 Like

yea, that’s what i am planning to do.

Do you know of a good way to display that data on Lovelace back again?

Hm, there are sql sensors, don’t know about influxdb. I use Grafana for that as it is more powerful anyway

1 Like

Yes, i use grafana already. But wanted to see everything including switches etc on 1 screen, and lovelace seemed like the right interface.
May be there is something to display the grafana panel on lovelace, i will explore.

1 Like

hello, was there any resolution on this?

I have an esp with 7 sensors ( I have a few other builds with 4 ~5 that did the same thing)
in the logs, I never see a missing sensor reply

however, in gafana there are large gaps in the logging and I am not sure why.

here is some esp log output and graf
(system esxi virtual machine 4 core 4g ram influx DB up to date)

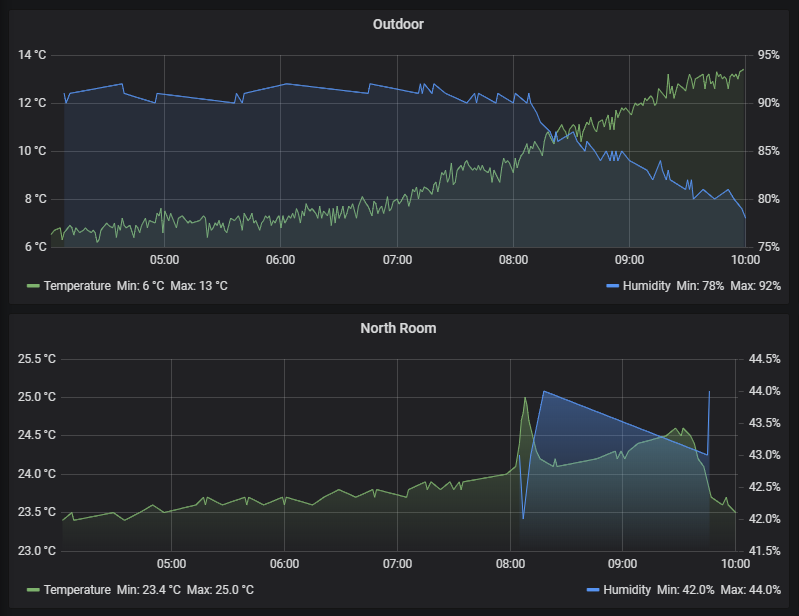
here is a second image of the graph where you can see that 3 temp-mid stop graphing
and 1 temp-water is not at all.
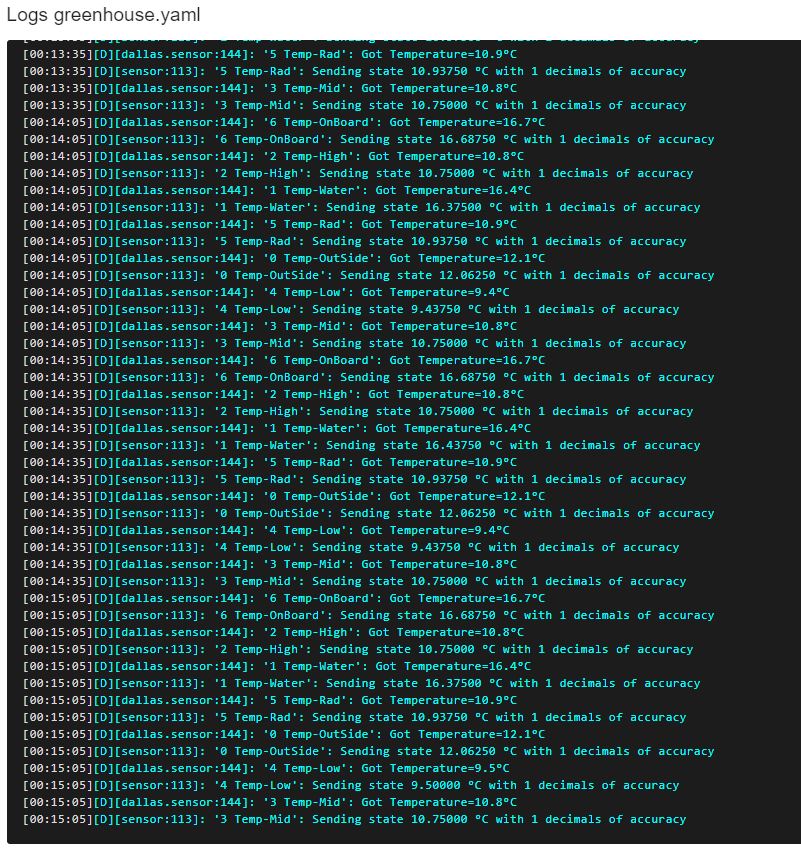
but no gaps in log

[00:28:05][D][dallas.sensor:144]: ‘1 Temp-Water’: Got Temperature=16.4°C
[00:28:05][D][sensor:113]: ‘1 Temp-Water’: Sending state 16.37500 °C with 1 decimals of accuracy

[00:28:35][D][dallas.sensor:144]: ‘2 Temp-High’: Got Temperature=10.9°C
[00:28:35][D][sensor:113]: ‘2 Temp-High’: Sending state 10.87500 °C with 1 decimals of accuracy
[00:28:35][D][dallas.sensor:144]: ‘1 Temp-Water’: Got Temperature=16.4°C
[00:28:35][D][sensor:113]: ‘1 Temp-Water’: Sending state 16.37500 °C with 1 decimals of accuracy

[00:29:05][D][dallas.sensor:144]: ‘2 Temp-High’: Got Temperature=10.9°C
[00:29:05][D][sensor:113]: ‘2 Temp-High’: Sending state 10.87500 °C with 1 decimals of accuracy
[00:29:05][D][dallas.sensor:144]: ‘1 Temp-Water’: Got Temperature=16.4°C
[00:29:05][D][sensor:113]: ‘1 Temp-Water’: Sending state 16.37500 °C with 1 decimals of accuracy

[00:29:35][D][dallas.sensor:144]: ‘2 Temp-High’: Got Temperature=10.9°C
[00:29:35][D][sensor:113]: ‘2 Temp-High’: Sending state 10.87500 °C with 1 decimals of accuracy
[00:29:35][D][dallas.sensor:144]: ‘1 Temp-Water’: Got Temperature=16.4°C
[00:29:35][D][sensor:113]: ‘1 Temp-Water’: Sending state 16.37500 °C with 1 decimals of accuracy

[00:30:05][D][dallas.sensor:144]: ‘2 Temp-High’: Got Temperature=10.9°C
[00:30:05][D][sensor:113]: ‘2 Temp-High’: Sending state 10.87500 °C with 1 decimals of accuracy

[00:30:05][D][dallas.sensor:144]: ‘1 Temp-Water’: Got Temperature=16.4°C
[00:30:05][D][sensor:113]: ‘1 Temp-Water’: Sending state 16.37500 °C with 1 decimals of accuracy

[00:30:35][D][dallas.sensor:144]: ‘2 Temp-High’: Got Temperature=10.8°C
[00:30:35][D][sensor:113]: ‘2 Temp-High’: Sending state 10.81250 °C with 1 decimals of accuracy
[00:30:35][D][dallas.sensor:144]: ‘5 Temp-Rad’: Got Temperature=10.9°C

[00:30:35][D][dallas.sensor:144]: ‘1 Temp-Water’: Got Temperature=16.4°C
[00:30:35][D][sensor:113]: ‘1 Temp-Water’: Sending state 16.37500 °C with 1 decimals of accuracy

[00:31:05][D][dallas.sensor:144]: ‘1 Temp-Water’: Got Temperature=16.4°C
[00:31:05][D][sensor:113]: ‘1 Temp-Water’: Sending state 16.37500 °C with 1 decimals of accuracy

[00:31:35][D][dallas.sensor:144]: ‘2 Temp-High’: Got Temperature=10.8°C
[00:31:35][D][sensor:113]: ‘2 Temp-High’: Sending state 10.81250 °C with 1 decimals of accuracy

[00:31:35][D][dallas.sensor:144]: ‘1 Temp-Water’: Got Temperature=16.4°C
[00:31:35][D][sensor:113]: ‘1 Temp-Water’: Sending state 16.37500 °C with 1 decimals of accuracy

[00:32:05][D][dallas.sensor:144]: ‘1 Temp-Water’: Got Temperature=16.4°C
[00:32:05][D][sensor:113]: ‘1 Temp-Water’: Sending state 16.37500 °C with 1 decimals of accuracy

[00:32:35][D][dallas.sensor:144]: ‘1 Temp-Water’: Got Temperature=16.3°C
[00:32:35][D][sensor:113]: ‘1 Temp-Water’: Sending state 16.31250 °C with 1 decimals of accuracy

[00:33:05][D][dallas.sensor:144]: ‘2 Temp-High’: Got Temperature=10.9°C
[00:33:05][D][sensor:113]: ‘2 Temp-High’: Sending state 10.87500 °C with 1 decimals of accuracy
[00:33:05][D][dallas.sensor:144]: ‘1 Temp-Water’: Got Temperature=16.4°C
[00:33:05][D][sensor:113]: ‘1 Temp-Water’: Sending state 16.37500 °C with 1 decimals of accuracy
[
[00:33:35][D][dallas.sensor:144]: ‘2 Temp-High’: Got Temperature=10.9°C
[00:33:35][D][sensor:113]: ‘2 Temp-High’: Sending state 10.87500 °C with 1 decimals of accuracy
[00:33:35][D][dallas.sensor:144]: ‘1 Temp-Water’: Got Temperature=16.4°C
[00:33:35][D][sensor:113]: ‘1 Temp-Water’: Sending state 16.37500 °C with 1 decimals of accuracy

[00:34:05][D][dallas.sensor:144]: ‘2 Temp-High’: Got Temperature=10.9°C
[00:34:05][D][sensor:113]: ‘2 Temp-High’: Sending state 10.87500 °C with 1 decimals of accuracy
[00:34:05][D][dallas.sensor:144]: ‘1 Temp-Water’: Got Temperature=16.4°C
[00:34:05][D][sensor:113]: ‘1 Temp-Water’: Sending state 16.37500 °C with 1 decimals of accuracy

[00:34:35][D][sensor:113]: ‘2 Temp-High’: Sending state 10.81250 °C with 1 decimals of accuracy
[00:34:35][D][dallas.sensor:144]: ‘1 Temp-Water’: Got Temperature=16.4°C
[00:34:35][D][sensor:113]: ‘1 Temp-Water’: Sending state 16.37500 °C with 1 decimals of accuracy
[00:34:35][D][dallas.sensor:144]: ‘5 Temp-Rad’: Got Temperature=10.9°C

How crazy, I was looking for a solution to this today and stumbled upon yours.

I unfortunately don’t have anything in the way of solutions to offer

All I can say is that I see the same issue you are:
image

For reference, this is a DHT22 logging both temperature and humidity every 60s.
My other ESP devices run DHT11s and exhibit the same behavior.

Any of yall ever come up with a solution? I seem to be doing the same thing and having the same problem. I have the InfluxDB integration set up to automatically ingest all datapoints from hass for the sake of displaying them in Grafana. I’m noticing that every so often, data points from my car integration will simply get dropped. For instance, my EV battery value went from 67% to 53% to 40% over the course of 3 data points and about a day, but the center datapoint appears in hass but not influx. This is rather consequential given how infrequently data comes in from the car.