I am re-formatting my initial post to make it hopefully easier to digest. I apologies in advance for the wall of text, but the situation is quite complex. ![]()
Hi All, I need some help with figuring out what is exactly happening in my instance with regards to History / Recorder / LTS.
I made a topic earlier here asking for help with my Energy Dashboard: despite how things are set up (seemingly correctly), the Energy Dashboard could not access data older than 1-2 weeks.
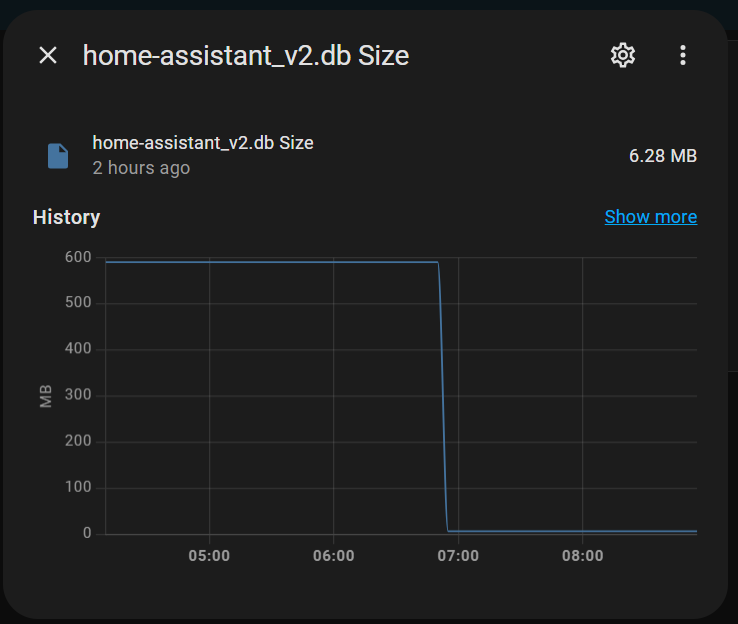
Today morning, I saw that my DB size shrunk from around 600 MB to 6 MB only. I believe this is the result of the auto-purge and repack HA does every 2nd Sunday as per the description in Recorder - Home Assistant (home-assistant.io). I immediately checked the sensor histories, statistics and sure enough, they are all gone, the data in the Energy Dashboard included.

Interestingly enough a few Apex charts I configured can still access some of the data from earlier, not sure why or how - though even here I can tell that the November values have changed whereas earlier it included data from the 25th, now it only includes data from the 27th.

You can read my detailed problem statement with regards to the energy dashboard in the above linked topic. As far as I could understand the Dashboard has been set up correctly, the configured entities are all set up with the right parameter (device class, state class etc.)

This is how my recorder is set up - I thought if I don’t configure it otherwise, even the auto purge that HA does every now and then would leave 10 days of sensor history data and entities that qualify for LTS (energy devices etc.) would be saved in LTS. It is not happening for some reason.
Initial Recorder configuration
recorder:
  exclude:
    domains:
      - device_tracker
      - media_player
    entities:
      - camera.doorbell_sub
      - camera.front_door_main
      - camera.front_door_sub
      - camera.garage_sub
      - sensor.memory_free
      - sensor.memory_use_percent
      - sensor.processor_use
      - sensor.ble_mac_50765cb7d9ea4e2199a4fa879613a492
Since I kept losing data, I changed the Recorder settings to include a huge keep_days interval. Since then my DB size has skyrocketed, but I was expecting this to happen.

New Recorder configuration
### Recorder ####
recorder:
  purge_keep_days: 730
  exclude:
    domains:
      - device_tracker
      - media_player
      - camera
    entity_globs:
      - binary_sensor.doorbell_*
      - binary_sensor.front_door_*
      - binary_sensor.garage_*
    entities:
      - sensor.memory_free
      - sensor.memory_use_percent
      - sensor.processor_use
      - sensor.ble_mac_50765cb7d9ea4e2199a4fa879613a492
      - sensor.p1_meter_wi_fi_strength
      - sendor.media_center_power
      - sensor.p1_meter_active_power
      - sensor.nobo_device_temperature
The SQLite table shows data that goes back only till the 10th of December - exact correlation with what I see in the sensor history view in the UI. There are only 57 rows, so certainly not in the range of anything in the Statistics-realm. This is I think the source of the problem - I would expect statistics to be stored going back before the 10th even with the initial and especially with the new recorder settings.

HA OS details
- Core2023.11.3
- Supervisor2023.11.6
- Operating System11.2
- Frontend20231030.2
Could you help me figure out what is happening? It is as if a full wipe took place on the 10th of December at 4:12 in the morning and there is no LTS or any kind of Statistics available at all in the system.