The solution is probably to use a “better” card than the sensor card, but I thought I’d report this in case someone else is experiencing the same problem.
there are multiple issues with iOs, I have cards that always need a refresh (e.g. meteo) and cards that do not show depending on the data behind it (apexchart1 fine, apexchart2 never). I moved to other cards to fix it for-me
I have had this identical issue since at least version 2022.11, and not just on iOS devices but on macOS as well. So could this be some Safari issue perhaps? Have not really looked into it using other browsers on Mac but with Safari this happens all the time, and is fixed by changing the view or refreshing.
All “Sensor Card” entities in the page start show the same data after random number of seconds, and there seems to be no pattern in which of the graphs it chooses.
I feel bad for bringing this old topic up, but I think I’ve encountered a similar issue with the Android app.
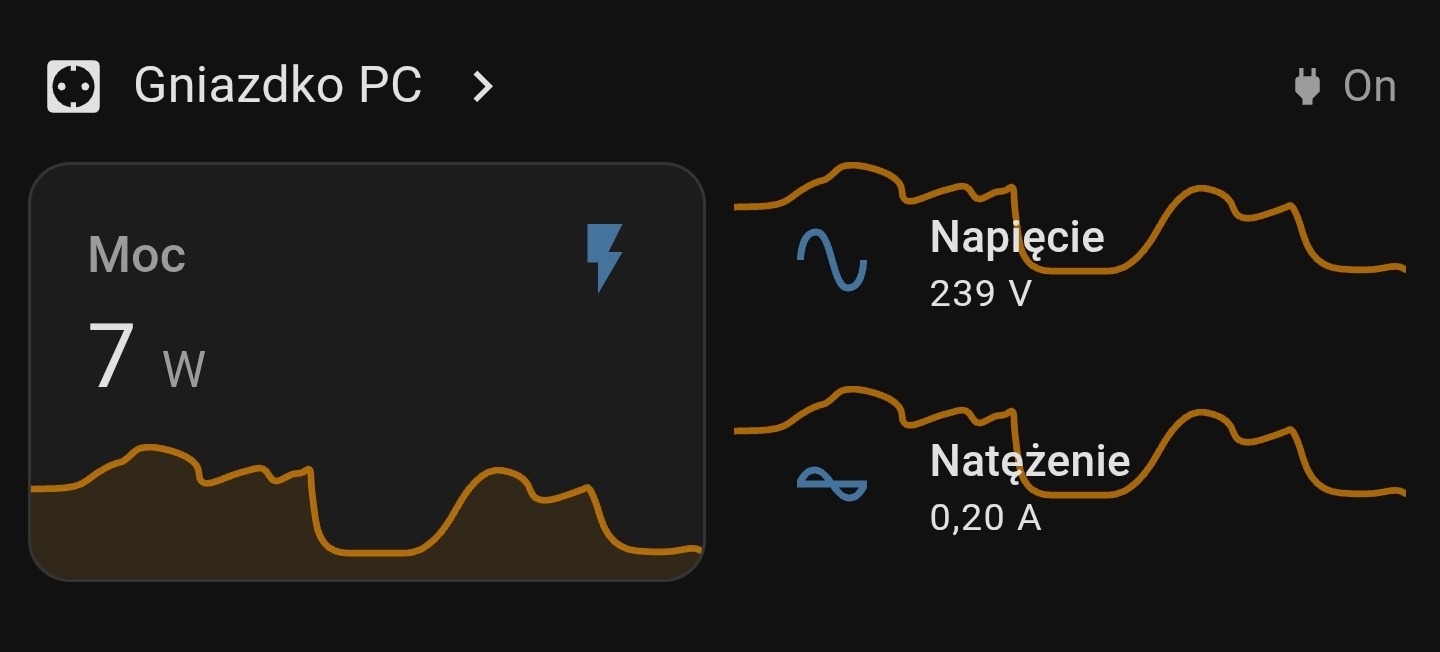
My issue is even funnier, as the graph is being “duplicated” on sections, that ARE NOT a “sensor history” cards.
The left card is a sensor history card. On the other hand, the cards on the right are simple “entity” cards (they do not implement any kind of graph) - but still, sometimes, somehow the graph from the sensory history card is being displayed on them too.
My guess is that some JavaScript query selector is not strict enough to apply the graph to the specific element only (and perhaps uses entity ID as a selector instead?)