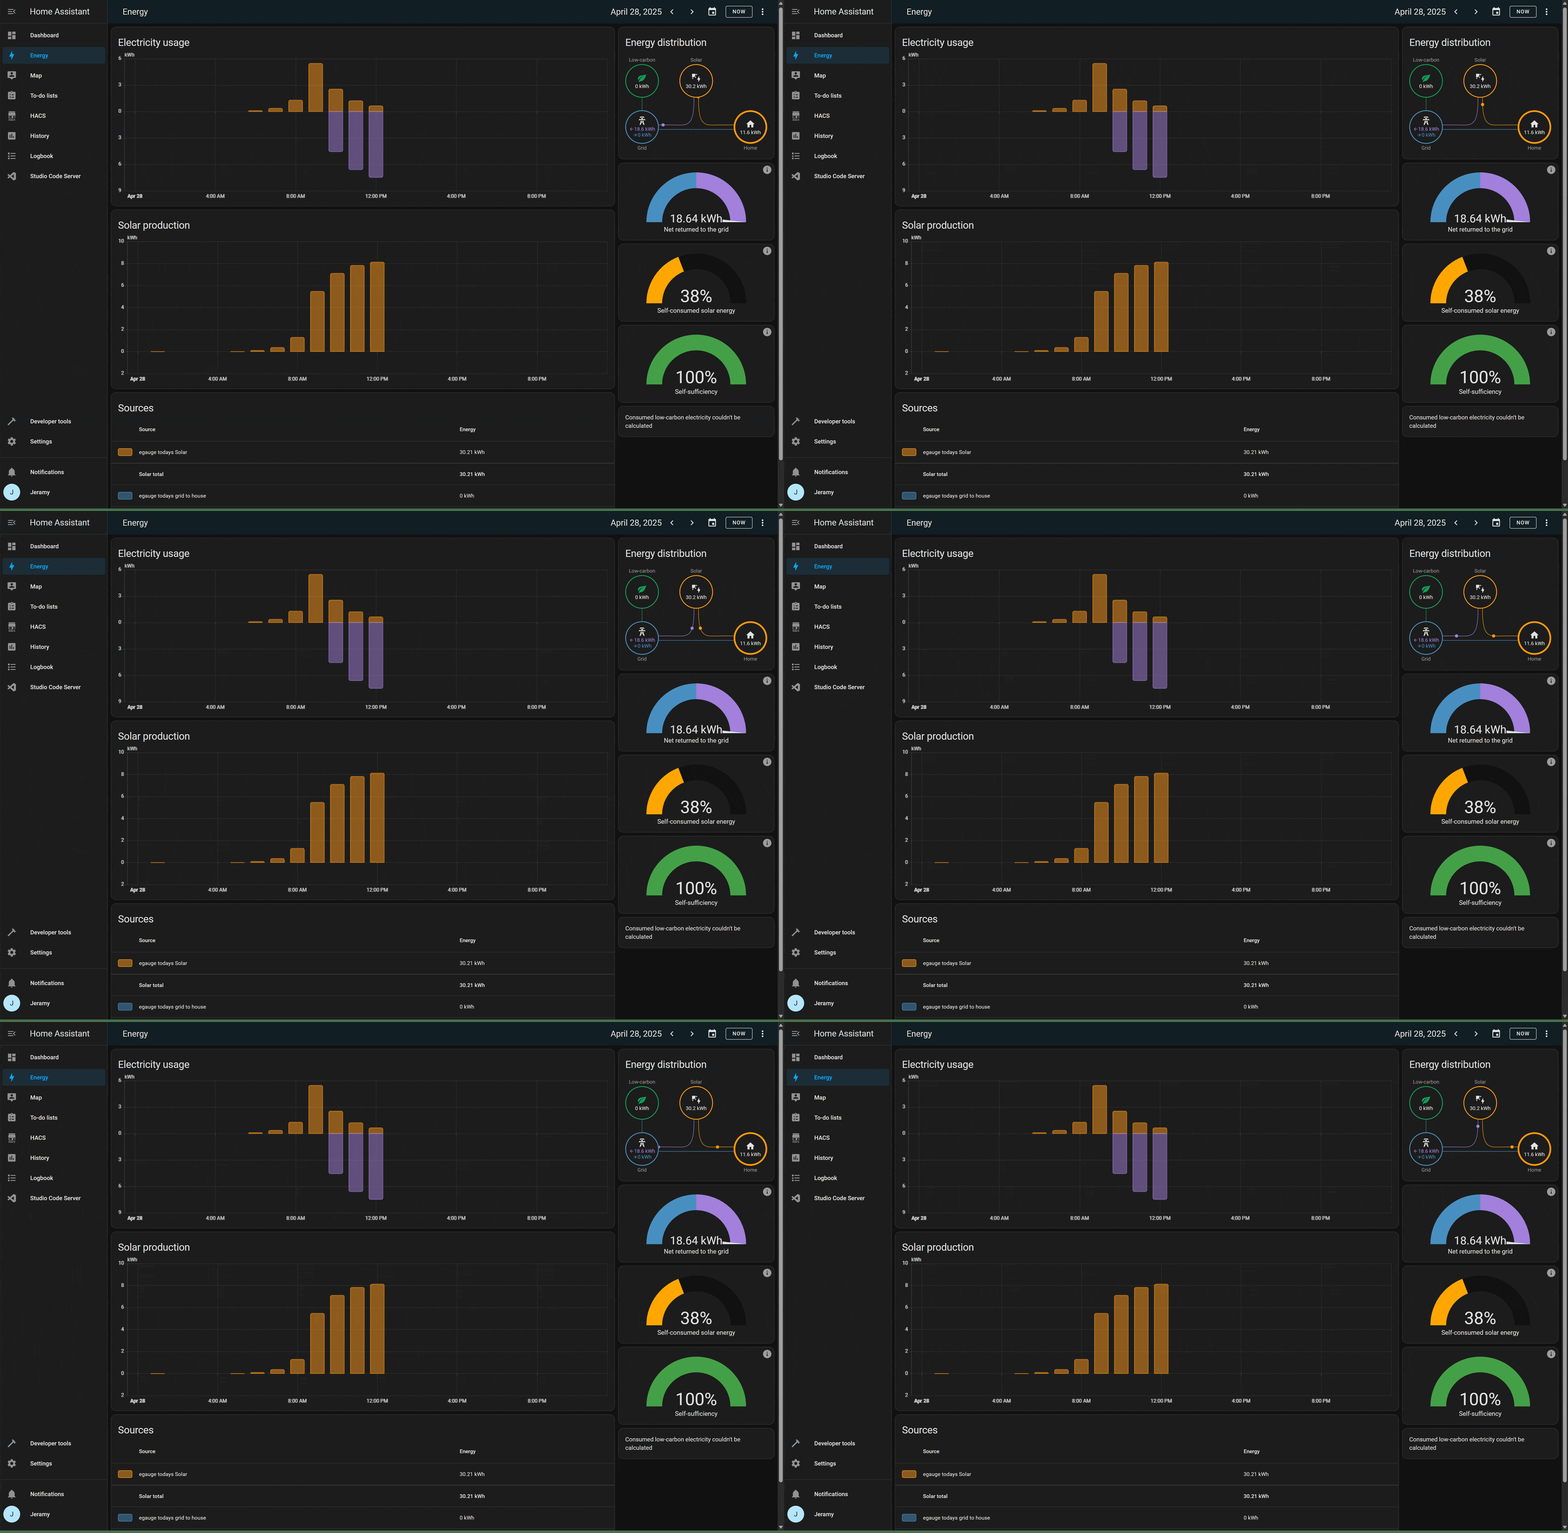
I have HassOS installed on a VM and an eGauge monitor connected to grid and solar that I wanted to display in the Energy dashboard. This was my first foray into Home Assistant. It took me a few days of reading docs and forums, and a lot of trial and error, but (I think) I have the Energy Dashboard working properly. I am sharing it here in case it can help anyone else. Here’s what I did:
Install the Component
First step is to install Home Assistant Community Store (HACS) from https://hacs.xyz/. This will let you easily install the eGauge component for Home Assistant from here: GitHub - neggert/hass-egauge: Home Assistant custom component for eGauge monitor
This gets your data in from the eGauge. Then you need to set it up for use by the Energy Dashboard.
Create the Helpers
The key piece is that when you are configuring the dashboard you need ‘Grid consumption’, ‘Return to grid’, and ‘Solar Production’ all as separate positive values.
Solar production is easy, you just set it to ‘egauge todays solar’. The others are harder because the grid reading is positive when energy is flowing to the house, and negative when flowing to the grid. To get the Grid consumption and return to grid as separate positive values, you need to create a couple of custom ‘Helpers’.
Go to Settings > Devices & Services, select the ‘Helpers’ tab, and hit the ‘Create Helper’ button. Select the Helper type ‘Template’. Select ‘Template a sensor’.
Give it a name like ‘eGauge Todays Grid to House’ and use this logic in the State Template:
{% if states('sensor.egauge_todays_grid') | float > 0 %}
  {{ (states('sensor.egauge_todays_grid') | float) | abs }}
{% else -%}
  0
{% endif %}
Set Unit of measurement to kWh, Device Class to Energy, State Class to Total, and Device to eGuage. Submit it.
Then create one for ‘eGauge Todays House to Grid’. The only difference is the logic in the State template:
{% if states('sensor.egauge_todays_grid') | float < 0 %}
  {{ (states('sensor.egauge_todays_grid') | float) | abs }}
{% else -%}
  0
{% endif %}
What these do is tells ‘eGauge Todays Grid to House’ to show the value if it is positive, otherwise show 0 and ‘eGauge Todays House to Grid’ shows the absolute value if it is negative, otherwise shows 0.
Configure the Energy Dashboard
Once the helpers are set, go back to the Energy dashboard, select the three dots and configure. Set ‘egauge todays solar’ as Solar production, ‘egauge todays grid to house’ as Grid Consumption and ‘egauge todays house to grid’ as Return to Grid. It took mine about an hour to start showing valid values after I created the helpers, but once it did this was my result:

Not sure what else I am going to do with it yet, but I am pretty pleased with getting it set up to read and display properly.