I have a steadily increasing sensor (water consumption). Now I want a second sensor showing the consumption of the last 24 hours. So the formula would be: s2 = s1[current] - s1[24h ago].
With the utility meter I get only the consumption of the current day. This is not what I want. I need a sliding window. How can I do this? Maybe there is already a custom filter making a delay?
  - platform: statistics
    name: "Water Used in the Last 24 Hrs"
    entity_id: sensor.your_sensor_here
    state_characteristic: change
    max_age:
      hours: 24
    sampling_size: 3500 # See below
You need to work out a sampling size with enough samples to cover 24 hours.
Sampling Size = 24 * 60 * 60 / <sensor update interval in seconds>
If your sensor updates irregularly make a guess at the average. Then increase the result of the calculation by 20%.
Watch the buffer_usage_ratio attribute of the sensor over a few days. You want this to be nearly full but never get completely full. i.e. close to 1 but never actually reaching 1.
2 Likes
can’t he use a utility meter for this as setup time as 24hours?
1 Like
The statistics sensor has now gone to “unknown”. The reason is that there was no change in the source sensor and so there is no new sensor value published. The statistics integration will not find values which are 24h old. What to do now?
Wait until it gets more states?
Or create a template sensor that sets the state to 0 if it is unknown.
Alternative solution using Node-Red
May I suggest an alternative solution that fetches a sensor value now, the sensor value from 24 hours ago, calculates x = s[now] - s[24hr ago] and populates a new sensor with the result, updated every how-often you like?
Added bonus - start and end readings (for period) as attributes
Node red code follows (this is the first time I have posted code like this so fingers crossed it is OK)
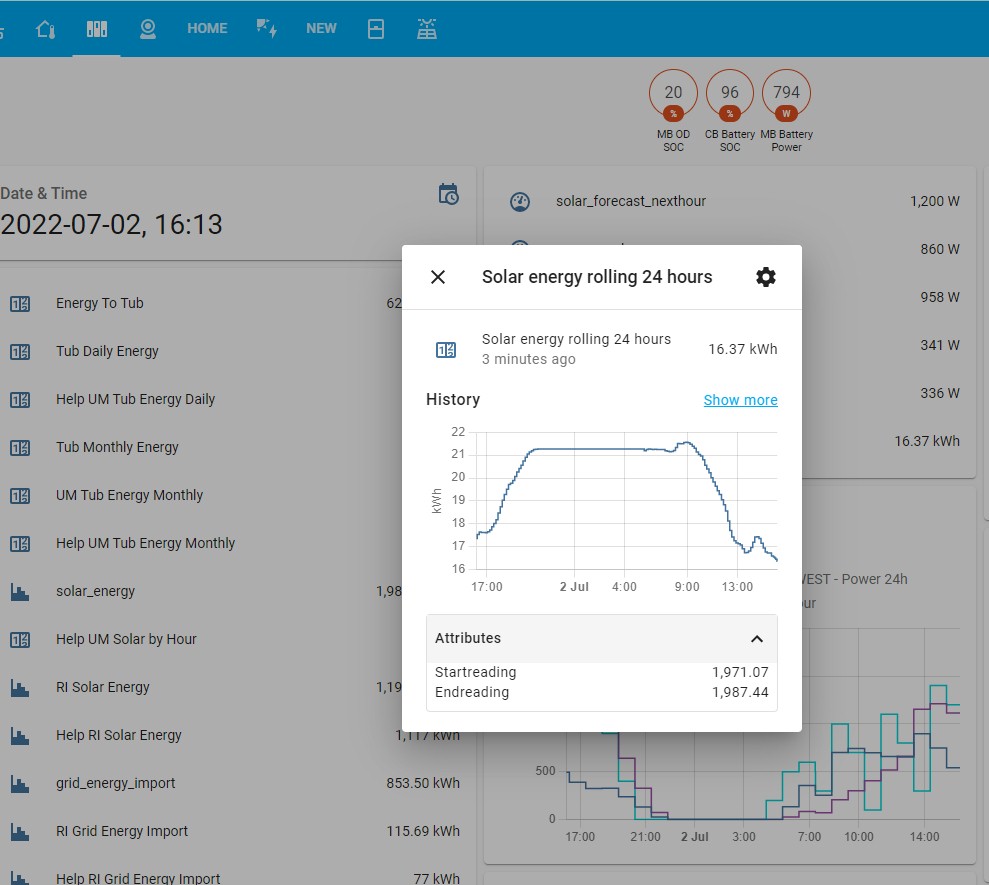
[{"id":"7a1df2413cd1c7ab","type":"api-get-history","z":"4a7ee910a33fb633","name":"solar energy history","server":"44b2605f.5d41","version":0,"startdate":"","enddate":"","entityid":"sensor.solar_energy","entityidtype":"is","useRelativeTime":false,"relativeTime":"24 hours","flatten":true,"output_type":"array","output_location_type":"msg","output_location":"payload","x":490,"y":1020,"wires":[["688d2cd4e62d8e5f"]]},{"id":"efbbacff28899875","type":"change","z":"4a7ee910a33fb633","name":"value now","rules":[{"t":"set","p":"topic","pt":"msg","to":"ending","tot":"str"}],"action":"","property":"","from":"","to":"","reg":false,"x":660,"y":960,"wires":[["7739434efee0e422"]]},{"id":"ec0aae998ff88568","type":"moment","z":"4a7ee910a33fb633","name":"-24:00 hr","topic":"","input":"","inputType":"date","inTz":"ETC/UTC","adjAmount":"1440","adjType":"minutes","adjDir":"subtract","format":"","locale":"en-GB","output":"payload.startdate","outputType":"msg","outTz":"Europe/London","x":180,"y":1020,"wires":[["48f74368712ac9bb"]]},{"id":"8f55ae6fb8316574","type":"inject","z":"4a7ee910a33fb633","name":"Every 10 minutes - clean object","props":[{"p":"payload"}],"repeat":"600","crontab":"","once":false,"onceDelay":0.1,"topic":"","payload":"{}","payloadType":"json","x":230,"y":960,"wires":[["ec0aae998ff88568","d37837e57c12c80b"]]},{"id":"48f74368712ac9bb","type":"moment","z":"4a7ee910a33fb633","name":"-23:59 hr","topic":"","input":"","inputType":"date","inTz":"ETC/UTC","adjAmount":"1439","adjType":"minutes","adjDir":"subtract","format":"","locale":"en-GB","output":"payload.enddate","outputType":"msg","outTz":"Europe/London","x":320,"y":1020,"wires":[["7a1df2413cd1c7ab"]]},{"id":"688d2cd4e62d8e5f","type":"change","z":"4a7ee910a33fb633","name":"value then","rules":[{"t":"set","p":"payload","pt":"msg","to":"$number(payload[0].state)","tot":"jsonata"},{"t":"set","p":"topic","pt":"msg","to":"starting","tot":"str"}],"action":"","property":"","from":"","to":"","reg":false,"x":670,"y":1020,"wires":[["7739434efee0e422"]]},{"id":"d37837e57c12c80b","type":"api-current-state","z":"4a7ee910a33fb633","name":"solar energy now","server":"44b2605f.5d41","version":3,"outputs":1,"halt_if":"","halt_if_type":"str","halt_if_compare":"is","entity_id":"sensor.solar_energy","state_type":"num","blockInputOverrides":false,"outputProperties":[{"property":"payload","propertyType":"msg","value":"","valueType":"entityState"}],"for":"0","forType":"num","forUnits":"minutes","override_topic":false,"state_location":"payload","override_payload":"msg","entity_location":"data","override_data":"msg","x":490,"y":960,"wires":[["efbbacff28899875"]]},{"id":"7739434efee0e422","type":"join","z":"4a7ee910a33fb633","name":"","mode":"custom","build":"object","property":"payload","propertyType":"msg","key":"topic","joiner":"\\n","joinerType":"str","accumulate":false,"timeout":"","count":"2","reduceRight":false,"reduceExp":"","reduceInit":"","reduceInitType":"","reduceFixup":"","x":830,"y":980,"wires":[["354d5492bd7b58d8"]]},{"id":"354d5492bd7b58d8","type":"change","z":"4a7ee910a33fb633","name":"Difference","rules":[{"t":"set","p":"payload.difference","pt":"msg","to":"$round(msg.payload.ending-msg.payload.starting,2)\t","tot":"jsonata"}],"action":"","property":"","from":"","to":"","reg":false,"x":970,"y":980,"wires":[["483da723e30a2bb2"]]},{"id":"483da723e30a2bb2","type":"ha-entity","z":"4a7ee910a33fb633","name":"solar rolling 24 hours","server":"44b2605f.5d41","version":2,"debugenabled":false,"outputs":1,"entityType":"sensor","config":[{"property":"name","value":"Solar energy rolling 24 hours"},{"property":"device_class","value":"measurement"},{"property":"icon","value":"mdi:counter"},{"property":"unit_of_measurement","value":"kWh"},{"property":"state_class","value":"energy"},{"property":"last_reset","value":""}],"state":"payload.difference","stateType":"msg","attributes":[{"property":"StartReading","value":"payload.starting","valueType":"msg"},{"property":"EndReading","value":"payload.ending","valueType":"msg"}],"resend":true,"outputLocation":"payload","outputLocationType":"none","inputOverride":"allow","outputOnStateChange":false,"outputPayload":"","outputPayloadType":"str","x":1160,"y":980,"wires":[[]]},{"id":"44b2605f.5d41","type":"server","name":"Home Assistant","version":2,"addon":true,"rejectUnauthorizedCerts":true,"ha_boolean":"on","connectionDelay":false,"cacheJson":false,"heartbeat":false,"heartbeatInterval":"30"}]
Screenshot …

I have set this up for my solar generation sensor (a Reimann Integral sensor from inverter power sensor) which updates every 20 seconds, so I have set a narrow 1 minute window for HA history. The default fetch is 24 hours which returns in this situation a very big array and I only want the first item. History node will return the state as it was at the point of the start datetime (and then for every state change within the start-end window) and current state node will return state now, so this should work no matter what the target entity state update frequency is.
You will, of course, need Node Red running (either as an add-on alongside HA or on another device) all the node types used (ie add node-red-contrib-moment using the pallet) a configuration node configured for the server connection to HA, and to change the local time zone (moment node), entity name (history, current state) and the code if you need to change rounding etc.
I hope this is of value to you or anyone else who wants to read and manipulate values from HA history recorder. Much as I like HA, there are certain things that appear to be overly difficult if not impossible to do with templates that take just a small amount of work in Node-Red, the get-history-node being one example.
4 Likes
I will wait until it is fixed…
1 Like
Noty sure why to use the sensor update interval, as the number of updates might not always be consistent.
I’m using:
  start: "{{ now() - timedelta( hours = 24 ) }}"
  end: "{{ now() }}"
This seems to work reliably as it is purely based on time.
You are confusing the history stats and statistics sensors. The statistics sensor does not have those options.
statistics would be lost at every HA restart, looking for alternatives…
I was looking for the same thing and didn’t find anything good enough, so worked out another solution using pyscript.
Sharing in case it’s useful to someone else, and in case anyone has ideas to make it better.
It works by creating for each monitored sensor.example a new sensor pyscript.24h_example containing the list of (differences of) values for each hour of the last 24h, the time of last update, the value of last update, and (as the main sensor value) the sum of all differences in the last 24h. Each time the script is run, it computes the difference between the current value and the value of last update and adds it to the list while removing the list’s first value. It checks if the update is run at each hour. If not it either doesn’t update the sensor, or guesses approximate values if last update was between 2 and 23h ago (not precise, but good enough if it doesn’t happen too often). If the system was offline for more than 24h it resets the sensor. Writes errors in log to help debug.
Not perfect because
- sensors must be in the pyscript domain to make them persistent across restarts (so they cannot be reused with some platforms like utility meter, not that it would make much sense with this one in particular^^)
- this hack stores only hourly values, it’s not nearly real time, but that’s good enough for my needs
- needs an automation to run the script every hour.
- you need to list the sensors you want to monitor in the script
(you can use an argument for the service function instead, it’d be cleaner) - you could modify it to store and run every 30min but not sure it would be wise^^
Here is the script (to be put in config/pyscript/anyfile.py once pyscript is installed):
(updated on jan 30th because persistence across reboots did not always work)
import datetime

# list of sensors to monitor
sensors = ["sensor.example1_total_energy", "sensor.example2_total_energy"]

@service
def update_energy_stats():
  """Script to update energy stat sensors"""
  #necessary to kill the script
  task.unique("energy_stats")

  today_datetime = datetime.datetime.now()
  today_str = today_datetime.strftime("%d/%m/%Y %H:%M:%S")

  for sensor in sensors:
      daily_sensor = sensor.replace("sensor.", "pyscript.24h_")
      try:
          energy_value = float(state.get(sensor))
      except:
          # sensor does not exist. Log error and continue with the next item
          log.error("sensor " + sensor.replace('sensor.', '') + " does not exist")
      else:
          if energy_value is None:
              # sensor is null. Log error and continue with the next item
              log.error("sensor " + sensor.replace('sensor.', '') + " has no value")
          else:
              go = True
              # make the sensor "restart-proof"
              state.persist(daily_sensor)
              attributes = state.getattr(daily_sensor)
              if attributes is None:
                  # sensor does not exist, we'll need to create it
                  values = [0] * 24
              else:
                  last_value = float(attributes["last_value"])
                  value_difference = energy_value - last_value
                  last_update = attributes["last_update"]
                  values = attributes["values"]
                  datetime_last_update = datetime.datetime.strptime(last_update, '%d/%m/%Y %H:%M:%S')
                  time_ago = round((today_datetime - datetime_last_update).seconds /3600, 2)
                  if time_ago >= 23.1:
                      values = [0] * 24
                      log.error("sensor " + daily_sensor.replace('sensor.', '') + " was updated " + str(time_ago) + " hours ago, so we reset it to zero.")

                  elif 0.9 <= time_ago < 23.1:
                      hours_ago = round(time_ago)
                      # if hours_ago == 1 everything is good
                      # otherwise, we missed one or several updates. Let's split the value difference into equal parts for the missing time (best guesstimate)
                      # this also works for hours_ago == 1
                      value_slice = value_difference / hours_ago
                      values = values[hours_ago:] + [value_slice] * hours_ago  # slide the list of values and add the new one(s)
                      if hours_ago != 1:  # log this for debug
                          log.error("sensor " + daily_sensor.replace('sensor.', '') + " was updated " + str(time_ago) + " hours ago, so we split it into " + str(hours_ago) + " equal parts :")

                  else:
                      log.error("Not updating sensor " + daily_sensor.replace('sensor.', '') + " (updated " + str(time_ago) + " hours ago)")
                      go = False
              if go:
                  last_24h_value = sum(values)
                  attributes = {
                      "last_update": today_str,
                      "last_value": energy_value,
                      "values": values,
                      "device_class": "energy",
                      "unit_of_measurement": "kWh"
                  }
                  state.set(daily_sensor, value=last_24h_value, new_attributes=attributes)

@time_trigger("startup")
def persistOnStartup():
    log.error("Persist pyscript energy stats on startup")
    for sensor in sensors:
        daily_sensor = sensor.replace("sensor.", "pyscript.24h_")
        state.persist(daily_sensor)


@time_trigger("shutdown")
def persistOnShutdown():
    log.error("Persist pyscript energy stats on shutdown")
    for sensor in sensors:
        daily_sensor = sensor.replace("sensor.", "pyscript.24h_")
        state.persist(daily_sensor)
Then I run the script hourly with an automation :
alias: Conso - Update energy hourly
description:
trigger:
  - platform: time_pattern
    minutes: "0"
action:
  - service: pyscript.update_energy_stats
    metadata: {}
    data: {}
mode: single
Works well. Anyone has ideas/critics ?