My electrical company is trying to get me to switch time-of-use plans to one of their new ones. In order to choose the best one (and also to help me choose the best charging times for my EV), I decided to see if I could simulate how my bill would look under these various plans.
The Teaser
This project is the most complicated one I’ve done in HA, so I expect this post to be pretty long, and I want to give you a peak at the finished product so that you can decide if you want to read the whole thing. Basically, I start from entities that report my gross electrical usage, like this:

and then I end up with something that shows me what my expected electrical bill is thus far in the in month:

The Backstory
Another project in this forum is one where people are using automations to match their excess solar production to charge their EV (https://community.home-assistant.io/t/optimizing-use-of-unused-solar-power-to-charge-a-tesla/340818/147). I wrote my own script to do this kinda thing, and then I realized that this isn’t how I want to be doing it. My electrical company aggregates all of our electrical use by month, which means that, if I generate excess electricity one day, and consume that same amount from the grid on a later day in the month, my electrical company considers that to be net zero usage. The take-away is that here in California, there’s no advantage to zeroing out my electrical surplus/consumption by the minute (although this is the case in some parts of the world, and the electrical companies in California are trying to bring that plan here, too).
Furthermore, since the electrical utility pays us a small fraction for monthly surplus generation than we pay to them for electrical consumption, that disturbs the idea of just maxing out your surplus during peak times and concentrating all of your consumption during off-peak. If you’re getting paid $0.04/kWh for your surplus peak energy from solar panels and paying $0.20/kWh for your off-peak consumption, that’s not as good as moving some of that off-peak usage to your peak time to use up your surplus. You can see, in the tile below, that I’ve got 20kWh of usage during off-peak, but about 35kWh of surplus generation during peak times, so, although it runs counter to conventional wisdom, it would be to my financial benefit to charge my EV during peak times to consume that 35kWh instead of adding 35kWh of off-peak consumption.

So, the initial impetus for this project was to make a EV charging supervisor which would try to charge my car during times (“peak”, “off-peak”, and “partial-peak”) in order to only use up my net surplus for the month in each of those billing tiers. Then, I realized that it could be used even if you don’t have solar panels or an EV and just want to know what billing plan works out best for your electrical usage pattern.
The Process
Basically, you need the following things:
- A way of measuring your home’s electrical consumption (and generation, if you have solar panels) and making that available as an HA entity. You can do this with either a HAN device which talks to your smart electricity meter, or one of various home-made or commercial “energy monitor” devices.
- The utility_meter integration to aggregate those changes in electrical consumption to different ‘buckets’ for each of your billing tiers.
- An automation which, depending upon the time of day, changes which billing tier’s ‘bucket’ should receive the latest electrical consumption/production.
- (Only if you have solar and your energy monitor reports your generation and consumption as two different entities) A template which subtracts your “production” buckets from your “consumption” buckets.
- A template which multiplied your kWh totals for each tier by the price for that tier, sums them together, and presents them as a monetary total bill for the month.
Step 1 - Energy Monitor
I have a “Home Area Network” device which talks to my electrical meter and reports electrical consumption and production as separate entities. Because of this, I’m going to need to create many of these next components in pairs:

Step 2 - The Utility Meters
HA has a helper integration called “Utility Meter”. It has three particular properties that we need for this project:
- It watches a single numerical entity for changes in its value and adds that change to one of a set of ‘buckets’, each one with its own entity id.
- The bucket which gets aded to is determined by the value of a select box (which we can change with automations)
- The values of the buckets gets reset on a schedule that you can decide (daily, weekly, monthly, etc).
Go to Settings->Devices & Services->Helpers and add a new helper called “Utility Meter”

Here, I’m creating a meter called “Energy Received - EV2-B”. Because I have solar and because my energy monitoring totals my production and consumption separately, I need to create one for “Energy Delivered - EV2-B”. Also, because I have other rate plans that I’m testing, I need to create Utility Meter pairs for “EV-A”, “EV2-A”, “TOU-C”, and “TOU-D”. Ten utility meters, in total.
You create the different “buckets” in the “Supported tariffs” section. Type in whatever you want to call the different buckets, but keep it consistent in order to make your automations simpler, later. If your energy monitor tracks consumption and production with a single entity, which goes up and down, then you want to turn on “Net consumption” (and you’ll only need to create one of these utility meters per billing tier and you can also skip Step 4)

Once I save this, this will create four new entities (one selector and one for each billing tier). We’ll need to know this naming for steps 4 and 5:
- select.energy_received_ev2_b
- sensor.energy_received_ev2_b_peak
- sensor.energy_received_ev2_b_off_peak
- sensor.energy_received_ev2_b_partial_peak
Once you finish these, you should be able to make a dashboard card which show the entities.

Here, you can see that energy consumption and production (what my energy monitor calls “Energy Delivered” and “Energy Received”, respectively) is spread among the three buckets for the billing tiers. Also notice that I’ve never produced excess energy (from my solar panels) during the nighttime “off-peak” tier, which makes sense. The buckets which currently receive any consumption/production additions are determined by the value of the two select boxes you see in the screenshot. It is important to note that there is no automated changing of these selectors when they’re created. You either need to change these selectors manually, or you create automations which do this, which is what we do in the next step.
Step 3 - Automating Time-of-Use Tiers
Go to Settings->Automations & Scenes->Automations
Create a new automation, and use the menu to “Edit in YAML”. We need to make use to template variables, which don’t seem to be supported in the visual editor, yet. We paste in the following code:
alias: Update Electricity Tariffs - EV2-B
description: ""
trigger:
  - platform: time
    at: "07:00:00"
    variables:
      tariff: partial-peak
  - platform: time
    at: "14:00:00"
    variables:
      tariff: peak
  - platform: time
    at: "21:00:00"
    variables:
      tariff: partial-peak
  - platform: time
    at: "23:00:00"
    variables:
      tariff: off-peak
condition: []
action:
  - service: select.select_option
    data:
      option: "{{ tariff }}"
    target:
      entity_id:
        - select.energy_delivered_ev2_b
        - select.energy_received_ev2_b
mode: single
What we’re doing here is setting the value of a variable called “tariff” to be either “peak”, “off-peak”, or “partial-peak” depending upon the time. Then, we are setting two entities to that value. This is where you’ll be happy if you keep the names of your billing tiers consistent across all utility meters. You’ll also be happy if you named your different utility meters consistently, as we can just copy/paste this text into more automations and just find/replace “ev2_b” with “ev2_a”, for example.
Once you do this, it will take about a day for you to be sure that it’s changing both of your selectors together (unless you don’t have solar and only have one utility meter helper per billing plan) and at the right times.
Over time, you should see gradually increasing values for the tiers where only one of the tier buckets is increasing at any one time per utility meter (I accidentally left the off-peak graph off of the Production chart)


Unless you have an energy monitor which gives you a single value which goes up and down, what we need to do, at this point, is subtract our production from our consumption to find out net usage, per billing tier.
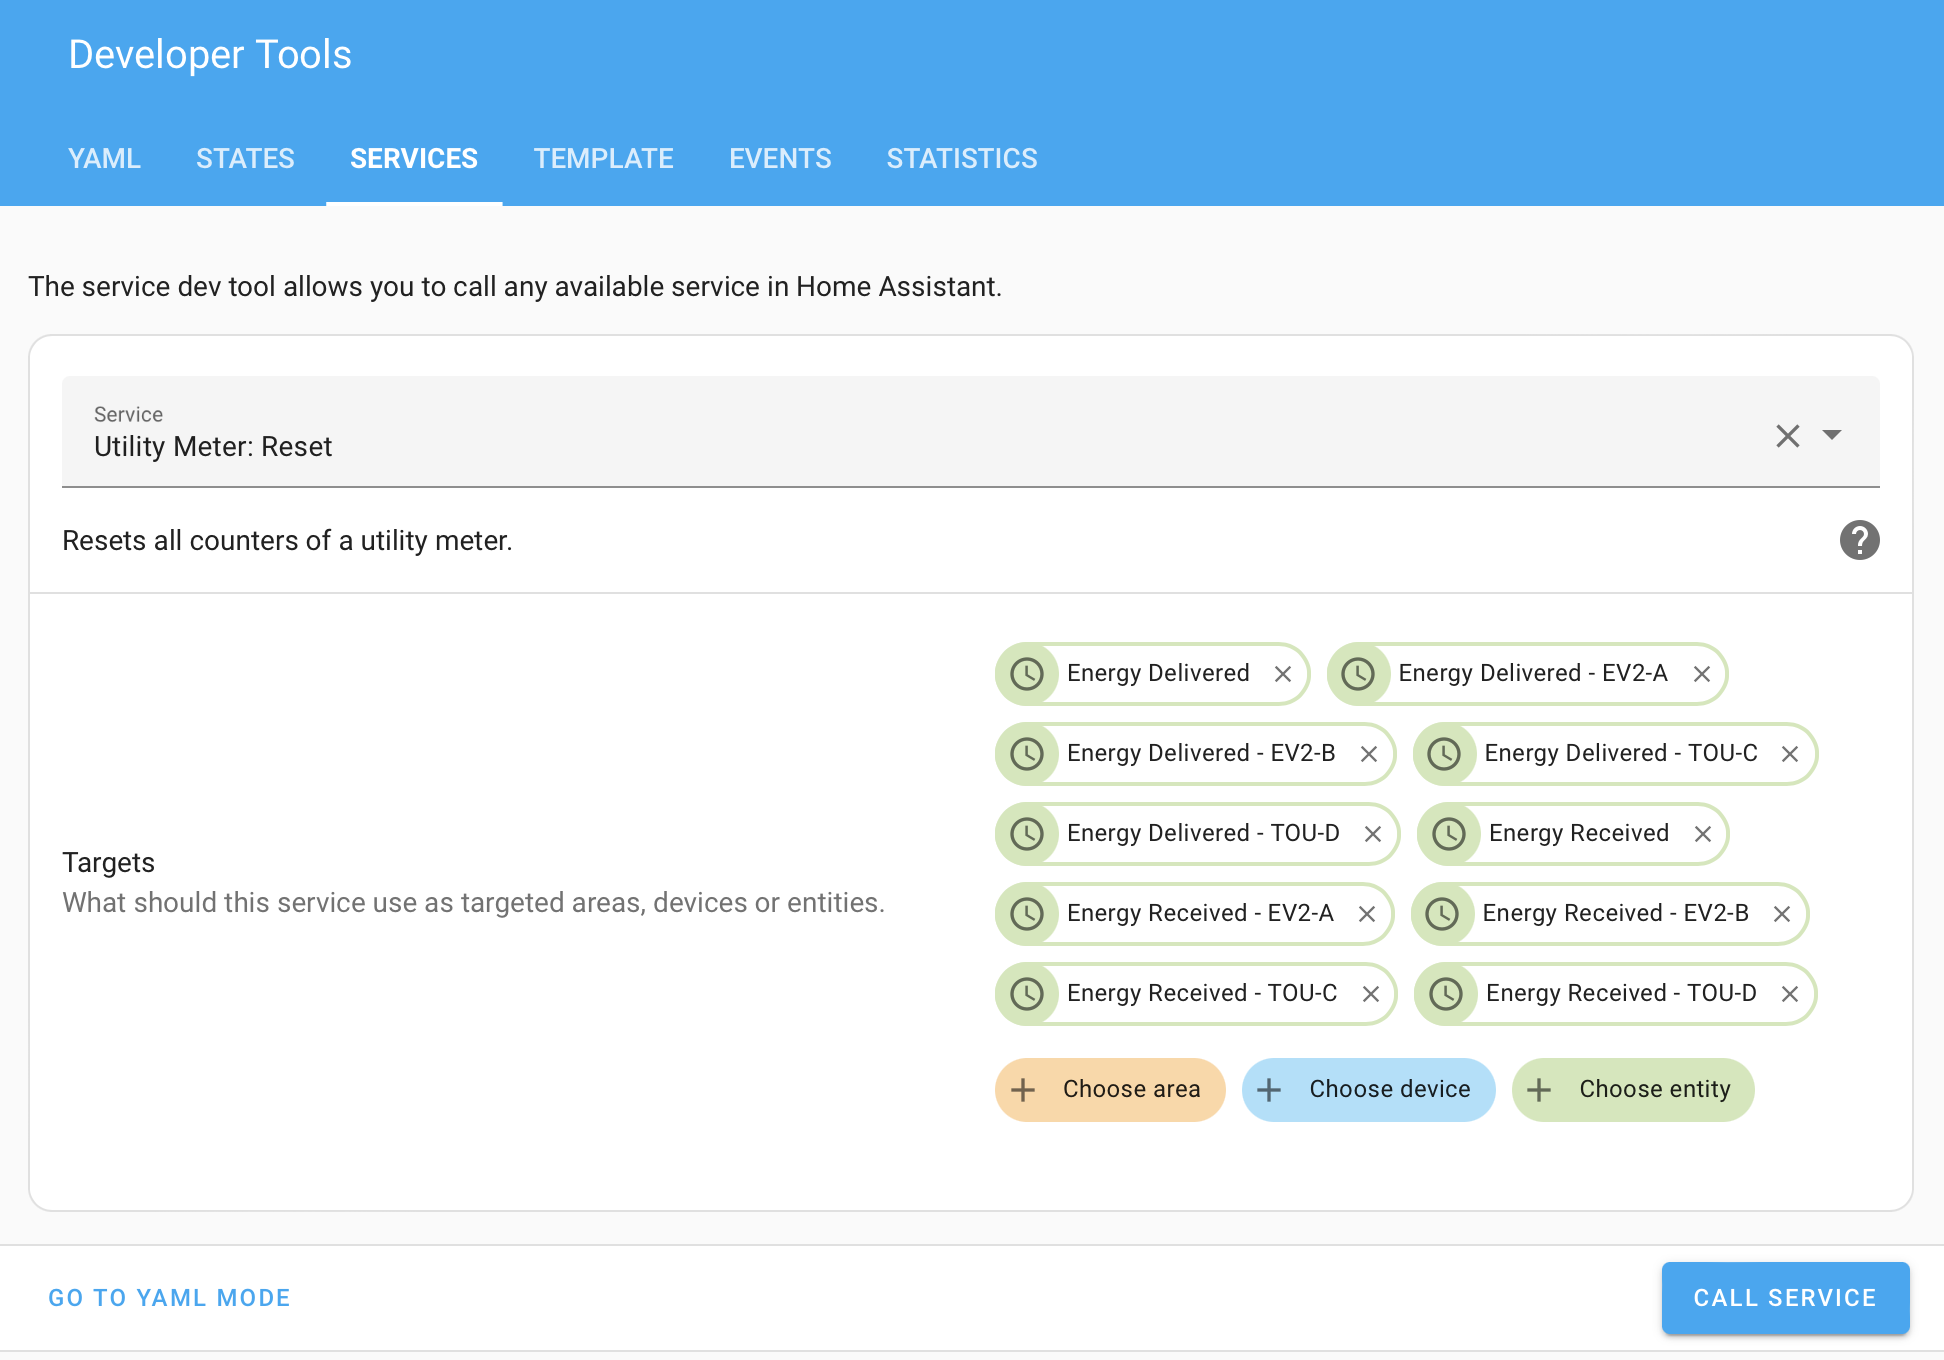
I should point out that, if you have a need to start over (for example, if you created one of these as a test, and then created the rest of your billing plans later, and now need to start them all at the same time for a sensible comparison), you can use the Developer Tools to send a reset to all of the utility meters.
Step 4 - Combining the Consumption and Production
HA uses templates in order to create entities based upon mathematical operations or complex conditions. You create these in YAML in either your configuration.yaml file or in one of the files which includes it. Here, I create three new sensors which are the differences between the delivered and received entities for each tier:
template:
  - sensor:
    - name: "Net Energy EV2-B - Peak"
      unit_of_measurement: "kWh"
      state: >
        {% set delivered = states('sensor.energy_delivered_ev2_b_peak') | float %}
        {% set received = states('sensor.energy_received_ev2_b_peak') | float %}
        {{ ( delivered - received ) | round(3) }}
  - sensor:
    - name: "Net Energy EV2-B - Partial-Peak"
      unit_of_measurement: "kWh"
      state: >
        {% set delivered = states('sensor.energy_delivered_ev2_b_partial_peak') | float %}
        {% set received = states('sensor.energy_received_ev2_b_partial_peak') | float %}
        {{ ( delivered - received ) | round(3) }}
  - sensor:
    - name: "Net Energy EV2-B - Off-Peak"
      unit_of_measurement: "kWh"
      state: >
        {% set delivered = states('sensor.energy_delivered_ev2_b_off_peak') | float %}
        {% set received = states('sensor.energy_received_ev2_b_off_peak') | float %}
        {{ ( delivered - received ) | round(3) }}
Each template fetches the value of one of the utility meter buckets, tells HA to treat it as floating-point numbers, and assigns it to a temporary variable called either “delivered” or “received”. Then, it assigns the value of the new sensor to the difference “delivered - received”. Note, here, that the sensor named “Net Energy EV2-B - Peak” will have an entity_id of “net_energy_ev2_b_peak”.
If this is the first time you’ve created a “template:” section in your configuration, then you’ll need to restart HA for it to get loaded. After that, you should be able to reload any changes by going to Developer Tools → YAML Configuration Reloading → Template Entities. Clicking on that will reload the template section and try to create/alter any sensors there. It’s good practice to check for any errors by going to Settings → System → Logs to see if there are any new errors thrown by the template system after reading your latest configuration. Once you have it working, you should be able to make a history graph showing the net consumption and production per-tier. Note that, at this point, we have graph lines which can go up and down, but we still only have one line changing at any one time. This is a great way to verify that our tiers are being changed by the automation at the correct times.
I have to create a similar array of sensors in the templates: section for each billing plan I want to evaluate. I’m evaluating five different plans (but some of them only have “peak” and “off-peak” tiers, no “partial-peak”, so I delete the third sensor from those).
Step 5 - Turning all of this into a dollar amount
To get a running expected bill from those net energy amounts, we need to multiply them by the cost of electricity in each of those billing tiers. Again, we turn to templates to do some simple math to generate some new entities. Go back to the template: section of our configuration.yaml file and add:
  - sensor:
    - name: "Electric Bill EV2-B"
      unit_of_measurement: "$"
      state: >
        {% if states('sensor.net_energy_ev2_b_peak')|float < 0 %}
          {% set peak_cost = states('sensor.net_energy_ev2_b_peak')|float * 0.04 %}
        {% else %}
          {% set peak_cost = states('sensor.net_energy_ev2_b_peak')|float * 0.60 %}
        {% endif %}
        {% if states('sensor.net_energy_ev2_b_partial_peak')|float < 0 %}
          {% set partial_peak_cost = states('sensor.net_energy_ev2_b_partial_peak')|float * 0.04 %}
        {% else %}
          {% set partial_peak_cost = states('sensor.net_energy_ev2_b_partial_peak')|float * 0.36 %}
        {% endif %}
        {% if states('sensor.net_energy_ev2_b_off_peak')|float < 0 %}
          {% set off_peak_cost = states('sensor.net_energy_ev2_b_off_peak')|float * 0.04 %}
        {% else %}
          {% set off_peak_cost = states('sensor.net_energy_ev2_b_off_peak')|float * 0.25 %}
        {% endif %}
        {{ (peak_cost + partial_peak_cost + off_peak_cost) | round(2) }}
This is going to create a new entity called “electric_bill_ev2_b”. Note that this code has the ability to have a different rate for whether your net energy usage is positive or negative. In this case, I have it configured to pay me $0.04/kWh for net surplus for the month regardless of the tier, and, if I have a net consumption of energy for any tier, I pay the published rate (eg. $0.60/kWh for peak time).
Again, I have to create four more of these, each with their own prices for buying and selling energy at the different billing tiers. What I’m left with is a handful of sensors giving me monetary estimates of what my bill would look like under all of my electric utility’s available plans, like I showed at the top of this post:
I hope this ends up helping some of you select the best rate plan for your house. I was planing to make a YouTube video which went through all of this, but I forgot to record audio, so let me know if you really want a video, and I might go back and record audio to all of the screen capture. Comments welcome. Enjoy!