Hi all, I have finished deploying my smart water level sensor for measuring the water level in a borehole. It can be integrated with Home Assistant and can even provide water consumption that is displayed in the energy dashboard.
The description below is the first version of a full description and I plan to update with more photos and more details about helper sensors that can be added.
A smart borehole depth measurement sensor
By Jeremy Cook
Version 2024.04.01
This is a description of my smart IoT sensor for measurement of the water depth in a borehole. The principle of the sensor is to measure water pressure at the lowest point of the well and convert this to depth or volume. For water, 1 bar of pressure usually equates to 10 meters of depth, and so from pressure we can calculate the depth of the water column in the borehole. In this solution the sensor values can be retrieved using the z-wave IoT standard protocol.
I am not much of an electronics wizard and so have used standard electronic components to construct the device part. The container is therefore quite large, but that doesn’t really matter as there is space
to install it in the intended location below the floor.
The IoT sensor uses a standard Z-wave component to communicate sensor values, and is compatible with Samsung smartthings, and can be used with Home Assistant. It was primarily designed to be used with a deep water borehole, but in principle it should work anywhere a submersible level sensor is required.
This document will be updated from time-to-time with additional photos and figures.
The Borehole
The borehole is close to the property. It has a diameter of 5.5 inches (13.95cm) and is approximately 65m deep. A borehole pump is fitted at the bottom of the borehole and pumps the water through a plastic food grade pipe to the surface. The pipe is connected to a pressure tank and configured so that the pump turns off when the desired pressure is reached and turns back on again when the pressure falls below a certain level. In this way we have constant running water.
In order to know more about the well, limitations during drought periods, and to help know what is happening when there is a high usage, I have built a level measurement system to monitor the borehole. Since the borehole is close to the property a true wireless solution is not required and the sensor cable is run from the borehole into the building.
The level sensor

The level sensor needs to be dimensioned for the borehole so that it can be calibrated correctly. The level sensor used in this case is an HDL300 liquid level transmitter calibrated for 65m depth, and with a cable length of 80 meters. Several options are normally available but in this case an output signal of
4-20mA is selected as this is most likely to provide a reliable signal over a long distance.
Fibaro Smart implant

Previously I used the Fibaro Smart implant to indicate when the pump was turned on and decided to repurpose this device for the well monitor. The smart implant can be set up to measure voltage on either of the 2 analogue inputs. With a voltage range of 0-10V it should be adequate for the depth
measurements required. The smart implant is a Z-wave IOT device and works well with Samsung smartthings. There is a 3rd party edge driver available (Fibaro Smart Implant Mc[1]) which can be installed in the smartthings hub and is working well.
Amps to Volts

Since the smart implant will measure Volts we need to convert the signal from mA to Volt. For this I used a simple A-to-V converter of the sort that seems to be available all over eBay and other sites for a few Euro. There are many to choose from, you can search for example for “Current To Voltage Module Transmitter Signal Converter” to find something similar.
Connecting the whole thing together
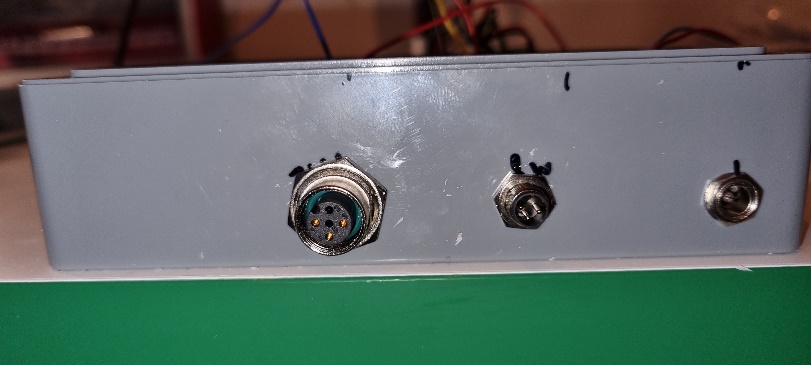
I chose to connect the different components together using Veroboard to marshal the inputs and power supply, and a small amount of soldering. I did it this way mainly because I already had a circuit made up for the previous pump monitor and I could use this with very little change. Power comes from an external 12V power supply which can be bought at many outlets selling electronics. A suitable connector was sourced from a local electronics outlet. To connect the signal wires from the pressure sensor I decided to use an M12 connector which gives a robust connection. I also connected a DS18B20 thermometer, obtained from a local electronics outlet to the implant for measuring temperature at the water inlet. This gives me some idea of whether to turn on a heater to prevent frozen pipes during winter. The DS18B20 is connected using an M8 connector. The M12 and M8 connectors are robust connectors and while not strictly speaking necessary (you could just pass the cables through the enclosure walls) they do make a convenient solution if any component requires maintenance, and the devices need to be disconnected.

Schematic showing how the components are connected together
The individual components are mounted in a watertight container using circuit board mounting posts. I have mounted everything in the lid of the container so that it is easier to access if maintenance is required. The connections between the components, and the connectors, are made using a combination of soldered connections and screw connections.

Annotated image of the components after connecting everything together in a watertight container.

During assembly it is important to remember that the pressure sensor uses the ambient pressure as a reference and has ventilation inside the cable. To help this the M12 connector needed a small perforation so that the pressure sensor works correctly.
Deployment


The well head is about 12m away from the building where the water is connected, and it was desired to have the electronics inside the building so that there is less chance of exposure to the weather, Luckily there is already a conduit underground from the well providing power to the pump, and there was enough room so that it was possible to thread the additional level sensor cable through the conduit alongside the power cable.
The well head has an alloy plate and a cover to protect from the elements and any debris. The sensor cable needs to pass through this alloy plate twice, and not damage the existing connections. I sourced 2 suitable robust cable glands, drilled 16mm holes to take these and mounted them on the plate. The glands function as cable supports and also to keep out dirt and water. During deployment it was important to remember which order the cable should be threaded through the plate and the glands.
Calibration
The sensor outputs current in the range 4-20mA, and ultimately, we would like to obtain the depth of water or even the volume of water in the well. This would update as water is used or as the well refills. To calibrate I used the voltage output from the A-V converter. The sensor cable is marked with a meter index every meter, so I used this for calibration. To calibrate I used a voltmeter rather than the IoT sensor since it gave an immediate readout. Briefly calibration consisted of determining the meter marker at the sensor, and the meter marker when the sensor is lowered into the well to exactly the top of the water. At this point the zero point of the A-V converter can be adjusted (left hand adjustment screw). Make a note of the meter marker at the well head at this stage and then lower the sensor until you reach down as far as you want it to go. Note the meter marker again. And adjust the range of the voltage output as you want it (right hand adjustment screw). I adjusted this to the maximum it would go which was about 7.5 V. The difference between the 2 noted meter markers is the depth of water measured by the voltage. The calibration factor C needed to calculate water depth – volts-per-meter – can be calculated as:
C = Vmax / d0 -d1
Where d0 and d1 are the 2 meter markers noted earlier. Depth in meters is then:
D = V.C
Smartthings IoT
The implant device used is compatible with Z-wave and works well with the smartthings hub which is already in place for a number of IoT devices. Smartthings gives access to all of the settings of the implant and allowed us to configure the input #2 as analogue voltage and set up things such as the reporting interval. Smartthings provides only the voltage, not the water depth. To get water depth you would need to create a virtual smartthings device that does the conversion as required. I haven’t done that so don’t cover how to achieve that here.
Home Assistant opensource smart home solution
The final smart home solution is to use Home Assistant so that the well depth and volume can be incorporated into a more general monitoring system. Using the smarththings integration for home assistant the voltage measurement is available to Home Asisstant. Volts is converted into depth and volume by using a template helper sensor. I wanted a volume in litres for display and for monitoring usage. Volume is easy to calculate from the depth and the well diameter. In my case I just used the well diameter as specified by the company that drilled the well (5 inches). To calculate volume in litres:
vol = 1000.D.π r2
Where D is the depth in meters and r is 2.5 inches (converted to meters).
My template in Home Assistant for the volume template helper sensor is as follows:
{{ (states('sensor.filtered_well_monitor_voltage_measurement') | float * 94.83) | round(2) }}
The helper sensor is created as a template sensor with device class Volume, and state class Total. The magic number 94.83 is my scaling factor calculated to scale volts directly into volume.

The figure above from Home Assistant shows the change in water depth during a couple of days of use. From the graph you can see that the water level drops quickly when it is used, and then rises more slowly. The rapid drop is because as water is used the pressure drops and the expansion tank will be filled quickly to build up pressure in the system again.
Sensor Noise
During testing it was evident that there is some sensor noise. As the water level stabilises at a natural level, the voltage will change very slowly and some fluctuations during these slow changes has been seen. This is not really a problem for level measurement, but I really wanted to measure usage, and even these slight fluctuations result in a “fake” consumption when there was no consumption. See figures below.
This can be mitigated by implementing a filter on the voltage measurement, either a lowpass filter or an average over several measurements. The final choice of filter has not been made yet as long-term testing is still on-going.


Additional sensors
Some additional virtual sensors based on templates and automations have been developed for indicating water inflow and usage. These may be documented in a later version of this document.
Parts list

In addition, you will need a z-wave hub. The sensor is developed and tested with smartthings z-wave.