I was not even known to the option to use other forecast …how did you achieve this as my dash only seems to allow Forecast.Solar…which does not keep history so I cannot provide a test with that
I tried to use Forecast.Solar last time, but I could not get it right. For whatever reason, their prediction didn’t come close to the actual production, and the chart was totally wrong. Spent days trying different things and still couldn’t get it right. Then @del13r introduced me to Solcast, and it was much better as you can see in the first screenshot. But then, I saw this scaling issue with the Energy dashboard.
It shows only today and tomorrow and during the day it is fine.
I was already looking at creating another sensor to compare forecast with history to cover exactly what you have (without the scaling then )
@tom_l Here is the oldest chart with forecast from 7 February, I think that was using Forecast.Solar. The scaling looks ok, I think. But, it looks like the forecast data are recorded in the history.
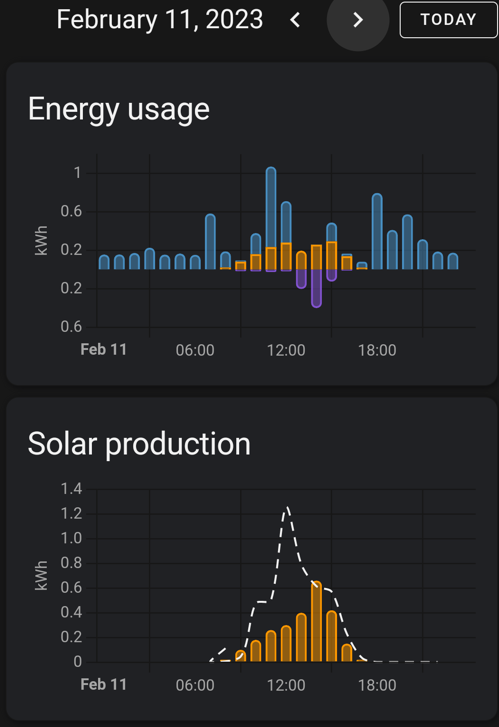
More forecast charts below. First I used Forecast.Solar. Then I switched to Solcast. Now, this might be related to the fact that I created 2 sites in 1 account in Solcast, but I don’t expect that would affect Energy dashboard Y-axis. Especially because on the day, the scaling was correct.
I can try to reset Solcast and create only 1 site tomorrow, and see how it goes.
It’s a forecast, that will mean the actual measured values can be different. So no scaling error, just a difference between the forecasted values and the real measured values.
It’s scaling issue on the Y-axis of the Energy Dashboard. Just look at those two screenshots from THE SAME DATE (on my first post). The Energy dashboard shows it different.
Of yes, definitely I understood it’s forecast, not real measured values.
Then I don’t know. As you can see, I do have historical data about the forecast on my Energy dashboard. And I don’t do any kind of special setting/configuration. I only added the Solcast component and use it.
I now see it. I checked my results, I don’t see the forecast-graph in my results from yesterday, only for today and tomorrow. I’m using Forecast.solar as my source.
So, I excluded sensor.solcast* in the recorder. Let’s see what happen in a few days, I hope they will be no longer recorded in the database. Wondering if I am the only one using Solcast The lucky one with this issue
@tom_l do you know where does the Energy dashboard get the data to plot the solar production forecast? Is it from the database? As you can see in my previous post, I have excluded all sensor.solcast from the recorder.
For unknown reason, the scaling issue seems to be fixed now. I didn’t change anything except excluding sensor.solcast* from the recorder database.
However, I still see past forecast graph older than yesterday. Sometimes I can see up to 4 days older, sometimes 7 days older. It’s weird, but I will accept it. It’s too difficult to debug this with my knowledge.
Solcast is quite accurate when the weather is relatively clear. If it’s cloudy rainy darky, then it’s way inaccurate. But that’s probably because I call update every 2 hours (I can max call 5 times with free account because of 2 sites).
With the forecast for a second installation, the y-Axis is apparently messed up: as you can see clearly, the forecast from the first image is now on the wrong scale in the y-axis where it should not exceed 0.3 kWh. However, it is above 1.4 kWh.


 The lucky one with this issue


