(Solved) Lovelace Sensor Graph (two sensors and two lines)

Lovelace Sensor Graph and two sensors
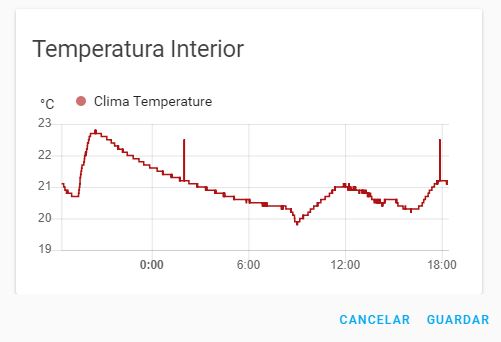
I have two temperature sensors and I want to represent their evolution in a single graphic, with two lines, as in this example from the Lovelace documentation.
history_graph_2lines
This is my configuration (I’ve made many different attempts) and I can’t get the result of the example.

entities:
  - sensor.clima_temperature
  - sensor.dht_temperature
title: Temperatura Interior
type: history-graph

history_graph_02

What am I doing wrong?
Thank you for your help.

1 Like

Do both sensors share the same units? Not sure if that could be the problem. Your config looks correct.

Yes, the two sensors measure the temperature in degrees Celsius.

Found the mistake.
Instead of sensor.dht_temperature, the right thing is sensor.dht22_temperature

1 Like

Ah, I kept staring at your code and couldn’t see anything wrong

I have no experience writing code. Next time I will be more attentive.
Thank you for your time.