I followed this great post to calculate the cost of one of my device, based on accumulated wattage and price for that time. I compared the entities numbers to what my power measuring device (a Shelly 3EM) reports, and the numbers are in-line. But the Statistics graph card is not showing the right values.
See my graph here:

chart_type: bar
period: hour
type: statistics-graph
entities:
  - sensor.jacuzzi_cost_in_sek_per_hour
stat_types:
  - max
title: Jacuzzi cost per hour
days_to_show: 1
If I go to the details of my entity I get the following (correct behavior, the 13:00-13:59 cost is around 0.91):
,
After exporting the data, I can see that the entity numbers are correct and they reset every hour, as expected at xx:00:00:
sensor.jacuzzi_cost_in_sek_per_hour,3.405043,2025-02-04T10:59:42.353Z
sensor.jacuzzi_cost_in_sek_per_hour,**3.421137**,2025-02-04T10:59:54.333Z
sensor.jacuzzi_cost_in_sek_per_hour,0.0,2025-02-04T11:00:00.033Z
sensor.jacuzzi_cost_in_sek_per_hour,0.020969,2025-02-04T11:00:09.336Z
...
sensor.jacuzzi_cost_in_sek_per_hour,4.558339,2025-02-04T11:59:17.061Z
sensor.jacuzzi_cost_in_sek_per_hour,**4.576615**,2025-02-04T11:59:31.430Z
sensor.jacuzzi_cost_in_sek_per_hour,0.0,2025-02-04T12:00:00.014Z
sensor.jacuzzi_cost_in_sek_per_hour,0.039598,2025-02-04T12:00:01.473Z
....
sensor.jacuzzi_cost_in_sek_per_hour,0.944552,2025-02-04T12:59:31.373Z
sensor.jacuzzi_cost_in_sek_per_hour,**0.945888**,2025-02-04T12:59:46.389Z
sensor.jacuzzi_cost_in_sek_per_hour,0.0,2025-02-04T13:00:00.031Z
sensor.jacuzzi_cost_in_sek_per_hour,0.002672,2025-02-04T13:00:01.410Z
The actual values from my Shelly:
|11:00|3.42|
|12:00|4.59|
|13:00|0.91|
|14:00|1.04|
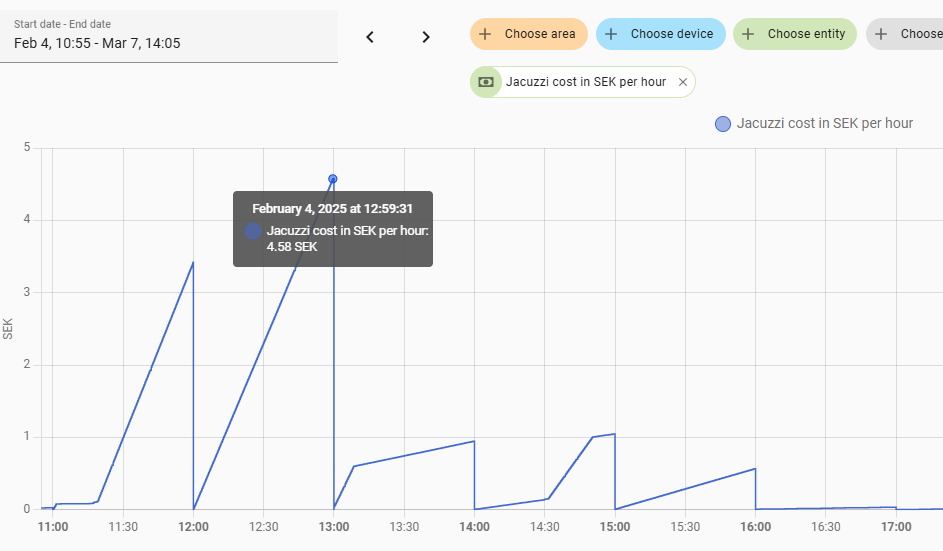
So 11:00 and 12:00 are correct, with respectivly 3.42 and 4.59(~4.57) SEK, but then you can see in the statistics graph that 13:00 and 15:00 are showing up the same number as the prebious hour. Same thing the previous night at 02:00 and 05:00.
Could it be that the entity resets a few miliseconds too late and the graph still shows the “old” value, a ms before resetting?
How can I fix that?