I have been looking around for a solution on this forum but can't find any. When i setup a statistic sensor in a stastics graph card it keeps saying "no statistics found" and i dont no why. I have these intergrations setup
Same for me I don’t think The statistics graphs card works with statistic sensors. try using a regular graph card or entities card, maybe even a auto-entities card.shoot even a gauge card will work.
and also That’s caused by a bug in the integration providing the entity. Integrations need to configure their entities correctly so Home Assistant knows that we need to track statistics for it and how.
Thanks i was confused, statistics sensor and statistics graph card suggest they have something to do with each other but apparently they are not. I have to look further to find out how to setup the sensor so that it can work in the statistics graph card.
It’s not a bug. You need to add state_class: with the proper long term statistic setting to your sensor. Some integrations do not allow this in their configuration. When that happens, you need to customize it via customize.yaml.
How would you do this? I’ve had errors adding in the template sensor config, and in customize.yaml too.
I have local tuya energy monitoring set up, but no statistics history, Should it be added like this? It gives an ‘extra keys not allowed’ error. Thanks.
Hey, I have two Aqara Temperature Sensors added via deconz. Both are woring, i.e. showing their temperature in HASS.
But if I add them to a statistics graph, only one shows up, the other doesn’t. Also, when I open the popup information of the one not working, it doesn’t show any data and saying “no statistics found”.
The Dev State insopector shows the same attributres for both:
state_class: measurement
on: true
unit_of_measurement: °C
device_class: temperature
friendly_name: OG Thermometer
Not sure which screen I found it on but I stumbled onto somewhere in HA that it had some of my sensors with a “Fix” button saying units had changed.
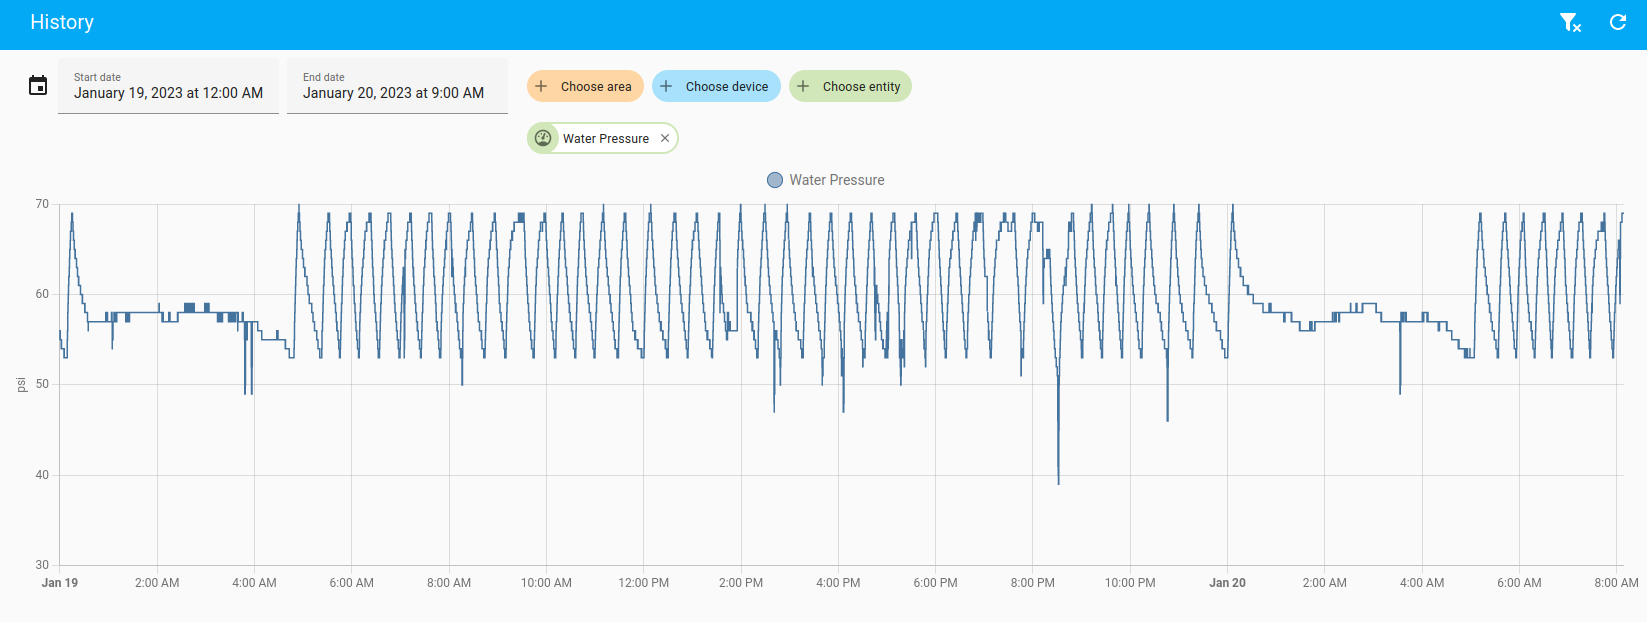
When I was trying to figure out I noticed my pressure sensor was in the list…hitting “Fix” saying the DB units didn’t match the sensor units seems to have cured the bad graph!
It wasn’t under “Repairs” and it wasn’t under the “Integrations > Entities”…I wish I could figure out how I got there. I think it was via a totally unrelated problem that popped up in “Repair” page. It was also a page that let me “Remove” some stuff that was long missing from the database.
Maybe someone else recognizes the page I’m describing?
Looks great. Could you tell what exactly happens when I remove all old data? Dies ist only remove the old data with the old entity or everything until now?
I tried doing this with the Mobile Device integration’s battery level and now it doesn’t show as needing fixed but the Statistic Graph is still showing “No statistics found” over 24h later and trying to re-create the graph card doesn’t even list my phone’s battery level as an entity I can add to a graph.
I think “Fix Issue” should actually read “Destroy Me”.