In my Home Assistant installation, I have a weird issue with using a statistics-graph in combination with some of my utility meters.
I have the following configuration for a card in my dashboard:
chart_type: bar
period: day
type: statistics-graph
entities:
  - sensor.zwembadpomp_dagelijks
stat_types:
  - state
hide_legend: false
days_to_show: 30
The sensor.zwembadpomp_dagelijks is a utility meter, which I made. It uses an energy state for a smart-plug I am using, which is an always increasing value.
When I add this card to my dashboard, the following errors show up in my log, when I try to display the dashboard.
Logger: homeassistant.components.websocket_api.http.connection
Source: components/websocket_api/connection.py:229
integration: Home Assistant WebSocket API (documentation, issues)
First occurred: 00:54:13 (65 occurrences)
Last logged: 12:19:28

[128796376501984] Error handling message: Unknown error (unknown_error) XXX from 10.210.0.1 (Mozilla/5.0 (Macintosh; Intel Mac OS X 10_15_7) AppleWebKit/537.36 (KHTML, like Gecko) Chrome/126.0.0.0 Safari/537.36)
[128796289557856] Error handling message: Unknown error (unknown_error) XXX from 10.210.0.1 (Mozilla/5.0 (Macintosh; Intel Mac OS X 10_15_7) AppleWebKit/537.36 (KHTML, like Gecko) Chrome/126.0.0.0 Safari/537.36)
[128796248154192] Error handling message: Unknown error (unknown_error) XXX from 10.210.0.1 (Mozilla/5.0 (Macintosh; Intel Mac OS X 10_15_7) AppleWebKit/537.36 (KHTML, like Gecko) Chrome/126.0.0.0 Safari/537.36)
[128796248154624] Error handling message: Unknown error (unknown_error) XXX from 10.210.0.1 (Mozilla/5.0 (Macintosh; Intel Mac OS X 10_15_7) AppleWebKit/537.36 (KHTML, like Gecko) Chrome/126.0.0.0 Safari/537.36)
[128796248150448] Error handling message: Unknown error (unknown_error) XXX from 10.210.0.1 (Mozilla/5.0 (Macintosh; Intel Mac OS X 10_15_7) AppleWebKit/537.36 (KHTML, like Gecko) Chrome/126.0.0.0 Safari/537.36)
Traceback (most recent call last):
  File "/usr/src/homeassistant/homeassistant/components/websocket_api/connection.py", line 229, in async_handle
    handler(self.hass, self, schema(msg))
                             ^^^^^^^^^^^
  File "/usr/local/lib/python3.12/site-packages/voluptuous/schema_builder.py", line 272, in __call__
    return self._compiled([], data)
           ^^^^^^^^^^^^^^^^^^^^^^^^
  File "/usr/local/lib/python3.12/site-packages/voluptuous/schema_builder.py", line 595, in validate_dict
    return base_validate(path, iteritems(data), out)
           ^^^^^^^^^^^^^^^^^^^^^^^^^^^^^^^^^^^^^^^^^
  File "/usr/local/lib/python3.12/site-packages/voluptuous/schema_builder.py", line 387, in validate_mapping
    cval = cvalue(key_path, value)
           ^^^^^^^^^^^^^^^^^^^^^^^
  File "/usr/local/lib/python3.12/site-packages/voluptuous/schema_builder.py", line 818, in validate_callable
    return schema(data)
           ^^^^^^^^^^^^
  File "/usr/local/lib/python3.12/site-packages/voluptuous/validators.py", line 755, in __call__
    or 'value must be one of {}'.format(sorted(self.container)))
                                        ^^^^^^^^^^^^^^^^^^^^^^
TypeError: '<' not supported between instances of 'str' and 'NoneType'
There are a couple of things, that I looked at:
- The utility meter contains the correct value and resets normally every day.
- I have this with a bunch of utility meters, but not all of them.
- My recorder configuration is default, as I only have
default_config:in my config, not using a different database.
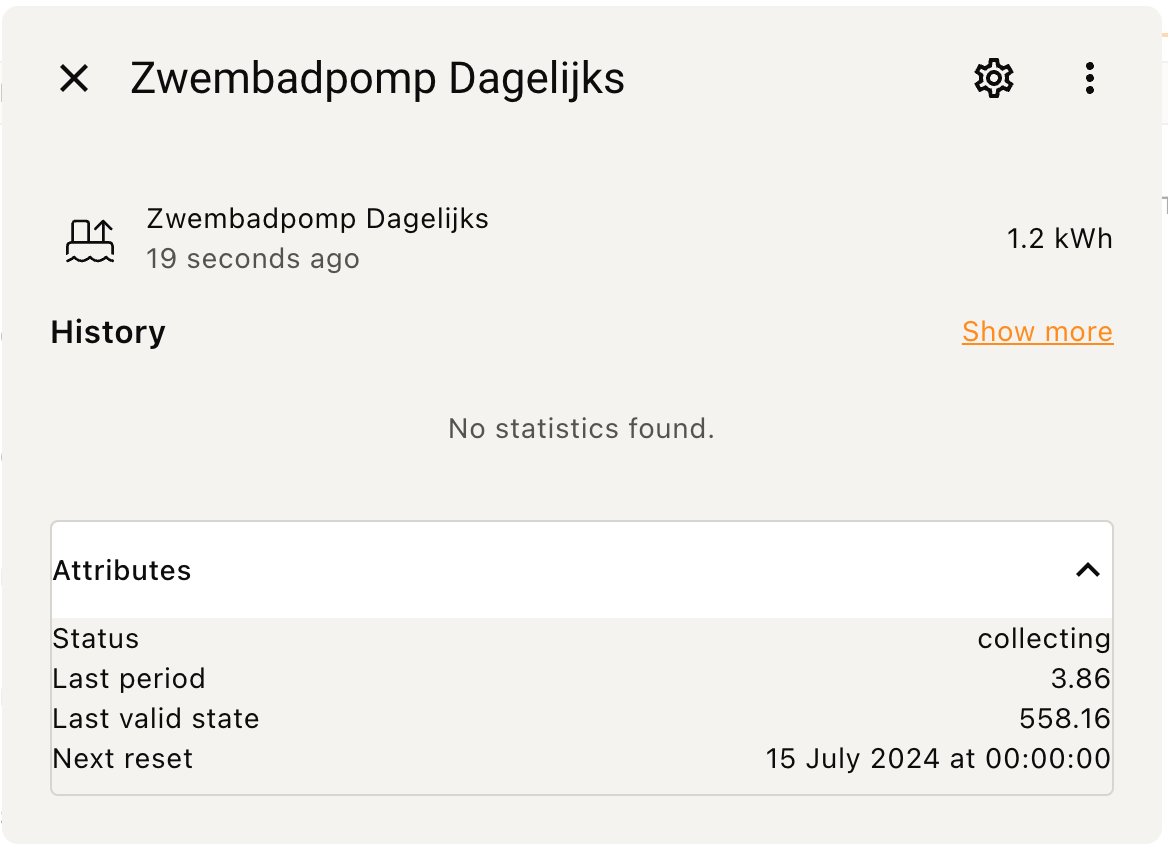
This is the popup when you click the sensor, here it says No statistics found.
When you look at the history of the sensor, it does show a graph though:
