I try to calculate the average power consumption per hour, using a DSMR meter throttled to 60s output.
My very initial thought was that a simple statistice sensor would do the job:
  - platform: statistics
    name: Power Consumed Avg Hr
    unique_id: sensor.power_consumed_avg_hr
    entity_id: sensor.power_consumed
    state_characteristic: mean
    max_age:
      hours: 1
    precision: 2
but of course it was not that simple, the max_age is not for this usage I realize once trying the sensor out. What I want is more of the equivalence of a bar diagram, as in 12-13 as opposed to the line diagram 13 onwards.
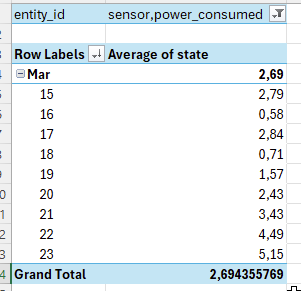
sensor created by Average integration, values from integration does not exacly match Excel averages, but they do the averaging slightly different, and down to the first decimal the align: