Hi,
I am a newbie in this automation world.
I have the Grafana Addon (or integration) installed in homeassistant.
I’ve made a sensor with an ESP8266 and a HTU21d (also I am measuring the internal VCC as this is powered by a LiPo). The device is going for nap of 3 minutes… then wakes up for 20 seconds and take as much measurements every 5 seconds.
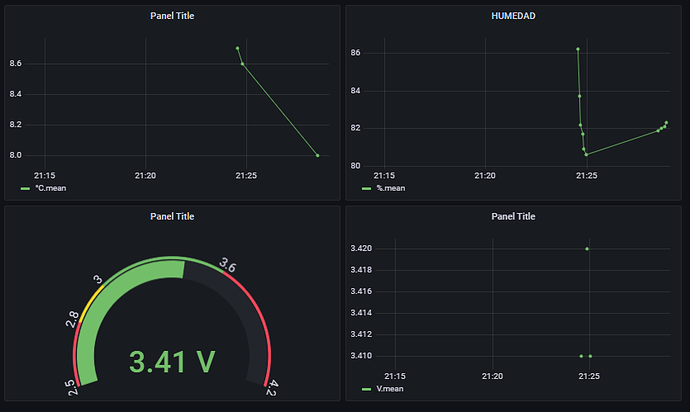
I made also a dashboard to plot those parameters over time
The system works, but I see a lot of inconsistencies in the data shown by Grafana, and reading by the ESPHome in the logs section.
Just to put an example, after a reset, in the ESPHOME logs, I see:
In the first cycle, it is sent 1 Vcc reading (at 21:24) and then the triplet of Temp/Hum/Vcc.
In the second cycle, six triplets has been send to HAS.
Then, if I go to grafana… I cannot find such measurements in the query…
For the first cycle, I find: 2 temp measurements, 6 humidity measurements, and 3 Vcc measurements.
I may understand that the logs are not reporting 100% of the communications between HAS and ESPHOME… so maybe in the background there are measurements not displayed in the logs.
But what confuses me, is the second cycle, as I can count: 1 Temp measurement, 4 humidity measurements, and none Vcc measurements… where the logs reported 6 measurements of all parameters.
I am also not familiar with Grafana, and I was trying to “see” the complete database, or to dump it to a CSV file to try to find the missing values… but I presume that the only way to interact with Grafana is through queries (the same way the panels does) so I expect that the result will be the same as the panel one.
What I am missing in this behaviour?
I attach a picture of my query on grafana (the one that miss more values)


