I’m aware that it uses a lot of resources, but its memory usage seems to be creeping up slowly and staying high even when I’m not using it. Is this normal behaviour?
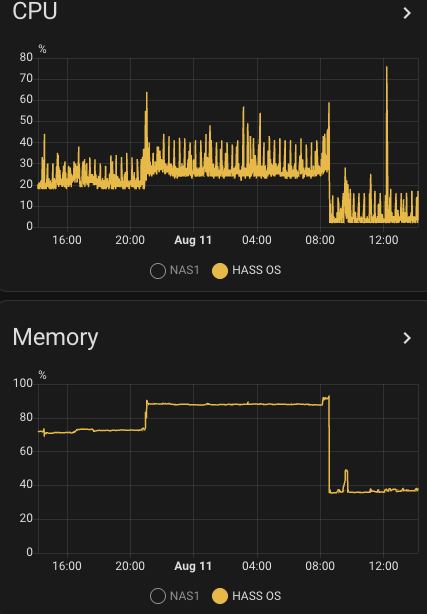
I suspect that for each session that you use Studio Code server it will reserve some memory and not release it. If you edit on different tabs / browsers / computers it will add up. As you can see in the memory usage graph (sensor.memory_use_percent) below the memory usage went down from 92% to 38%, more than half the memory on my system, this was when I did a restart of the Studio Code server. Just before the restart, I started a new session and memory usage went up to above 92%. On Aug 10 around 21:00 I started an other session where I opened multiple files, and the usage went from 70% to almost 90%, and this was never released.
The advantage is that when you go back to a session it remembers which files were open, etc. But for smaller systems like mine (I have 3.5G allocated to the VM that runs HAOS), this can cause issues if you edit many files from different tabs/browsers/computers.
It would be nice if we could see the amount of memory that this addon is using, so that we could have an automation send a message if the memory usage is too high. For now, I will make an automation that warns me if the HASS OS memory is above 90%, so that I can restart the studio code.
Nah, instead of workarounds (which I have in place already for a long time) the addon should just behave nicely out of the box in terms of resource usage.
A timeout after which resources are released would be the usual behavior. Or a switch to not store the session (for longer than X minutes/hours). The core issue is that currently it just never releases allocated memory resources.
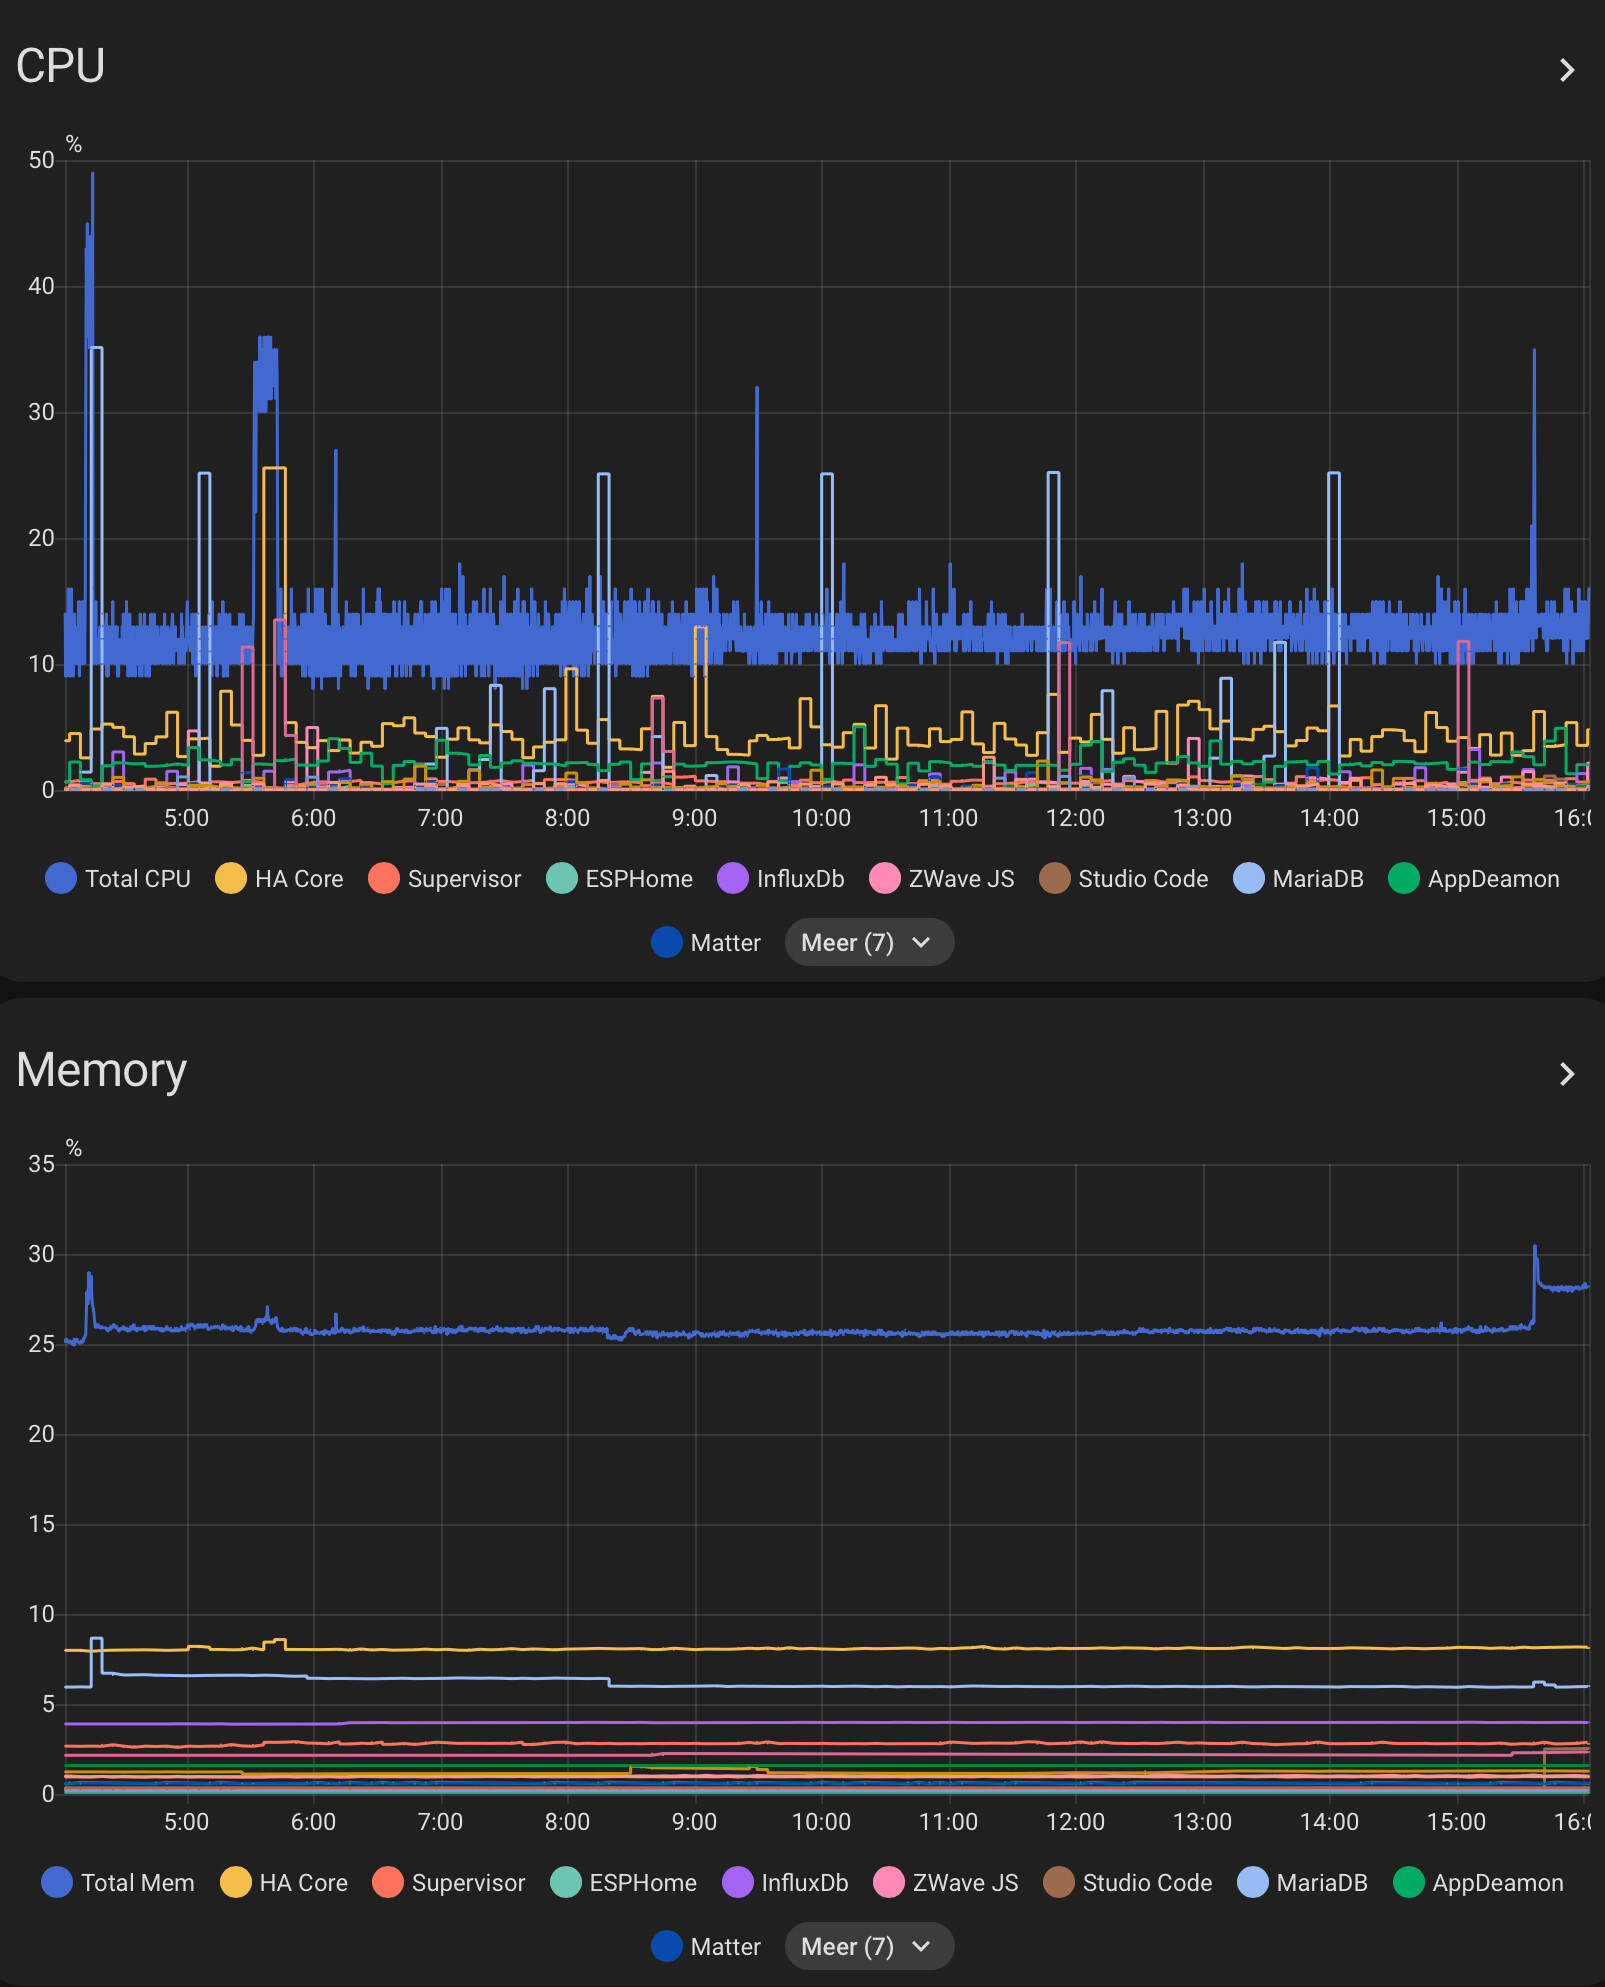
You can when using HAOS: Go to settings, integrations, supervisor and enble the memory and cpu entities for addons you want to monitor. Then create an automation if it exceeds your wishes, or put them in a graph: