I copied the settings and made some adjustments from this video:
SML Stromzähler lokal mit Home Assistant auslesen - PowerFox Alternative from simon42
Maybe I have a misunderstanding, but what do I need to change to convert it into a line chart?
The sensor is a few months old, and I had issues with energy consumption before. However, this was manageable because the few logs per day did not flood my logs.
Today, I received the letter with the PIN for the power meter, and since then, my logs have been spammed every second.
So, the energy consumption sensor is around 12 weeks old and had the same issue before, but now it has become a real problem with the power measurement.
How many days ago did you make the changes for device class, state class and UoM?
The older data will screw up the plotting until it’s purged from the DB.
Otherwise, if you don’t want to wait, you can temporarily reduce the recorder period or do a manual purge, or check under the statistics view under the dev tools whether there’s a fix issue button.
Short update: Changing to states() | float() sadly didn’t fix the problem.
@parautenbach I have had the sensor for around half a year now, and yes, I had to wait half a year for a letter with the PIN
For the total_increasing attribute, I changed it nearly at the beginning, but it didn’t work for me, so I let it be. The logs changed a few times per day. But since I get more data from the sensor, it now changes every few minutes too…
For the measurement attribute, I changed it a few minutes ago after implementing it, since I was getting a log every second.
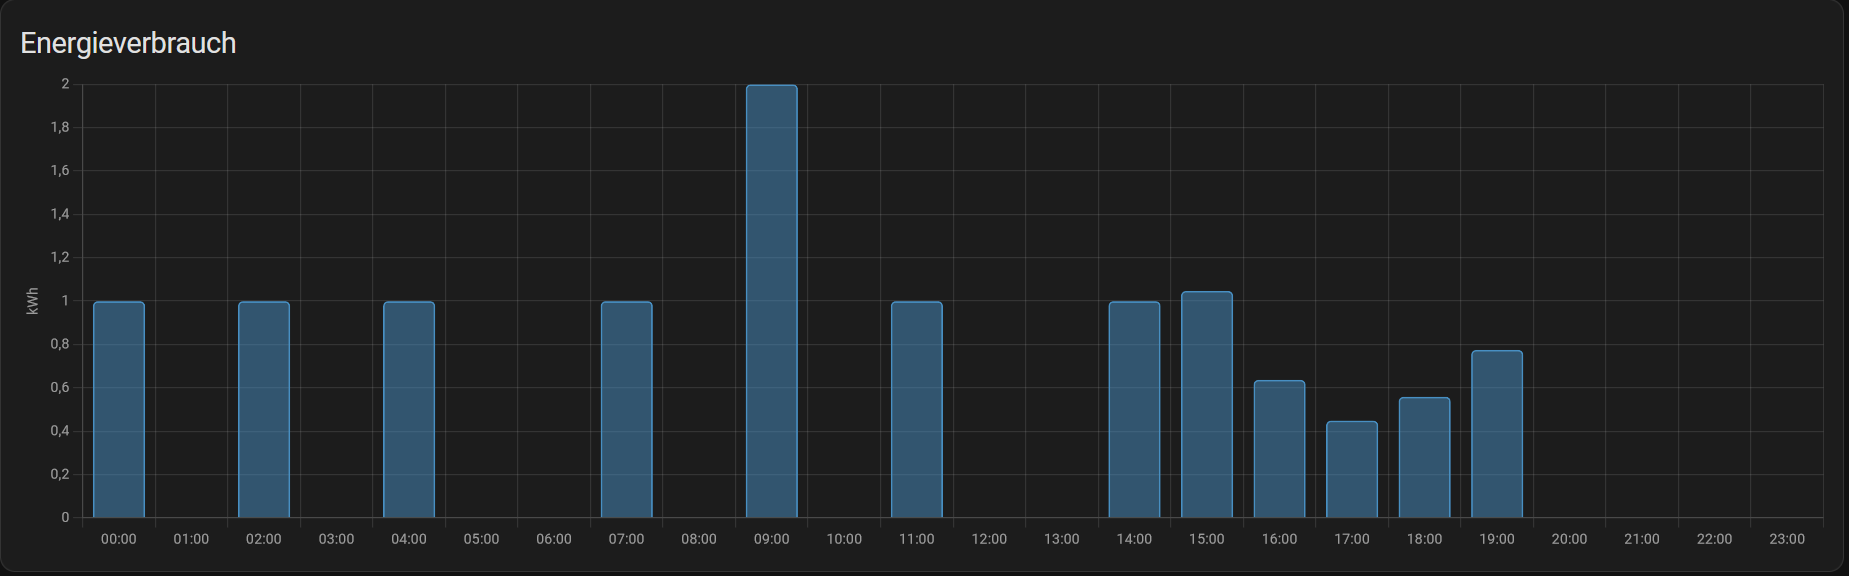
Now I found something super weird: when I look under statistics, it shows it like I want, but when I’m on the devices page, it’s still showing the block charts:
Tasmota is sending a string value, which is why the device page entity will always look like a graph of changing text. I don’t know of a way, particularly in YAML, to change this value to numeric, as it depends on your Tasmota and hardware config.
The float entity you created in YAML is a template sensor, which is effectively standalone and cannot appear on the device page even if they are defined with an underlying device’s entity — but you should still be able to use it for energy consumption.
In HA 2024.7 (pending release) there should be a new feature to link GUI-defined template sensors to their underlying device page. To try this, you will have to create new measurement & total_increasing sensors under Settings → devices → helpers → create → template, they should show up whenever that feature is released.
Indeed! I just added a device class to one of my textual Tasmota sensors, and the “bar” history instantly converts to a line graph, including a week of past data.
So it seems OP has two copies of the same sensor data, one is just a round(3) template of the other. Perhaps customizing the UoM, state and device class of the original achieves almost the same objective. Or perhaps I’m just misunderstanding the original question. Either way, thanks for the pro tip.