EDIT 16 FEB 2026:
- NEW icon and temperature value
- UPDATE better temperature scale for negative values
EDIT 12 feb 2026:
- UPDATE better visual
- ADDED night intensity given the HA core sun entity
- ADDED configuration of visible days (up to 60 days)
I know (and I used) specific heatmap extensions, but I wanted a fully custom and beautiful ![]() heatmap (and there’s a bug in existing HACS heatmaps, as they do not take into account local HA time which is an issue if you are following your installation from far away)… It’s finally a very simple to configure (copy/paste the following) and very responsive code, given that you have previously installed plotly and card-mod (see below)
heatmap (and there’s a bug in existing HACS heatmaps, as they do not take into account local HA time which is an issue if you are following your installation from far away)… It’s finally a very simple to configure (copy/paste the following) and very responsive code, given that you have previously installed plotly and card-mod (see below)
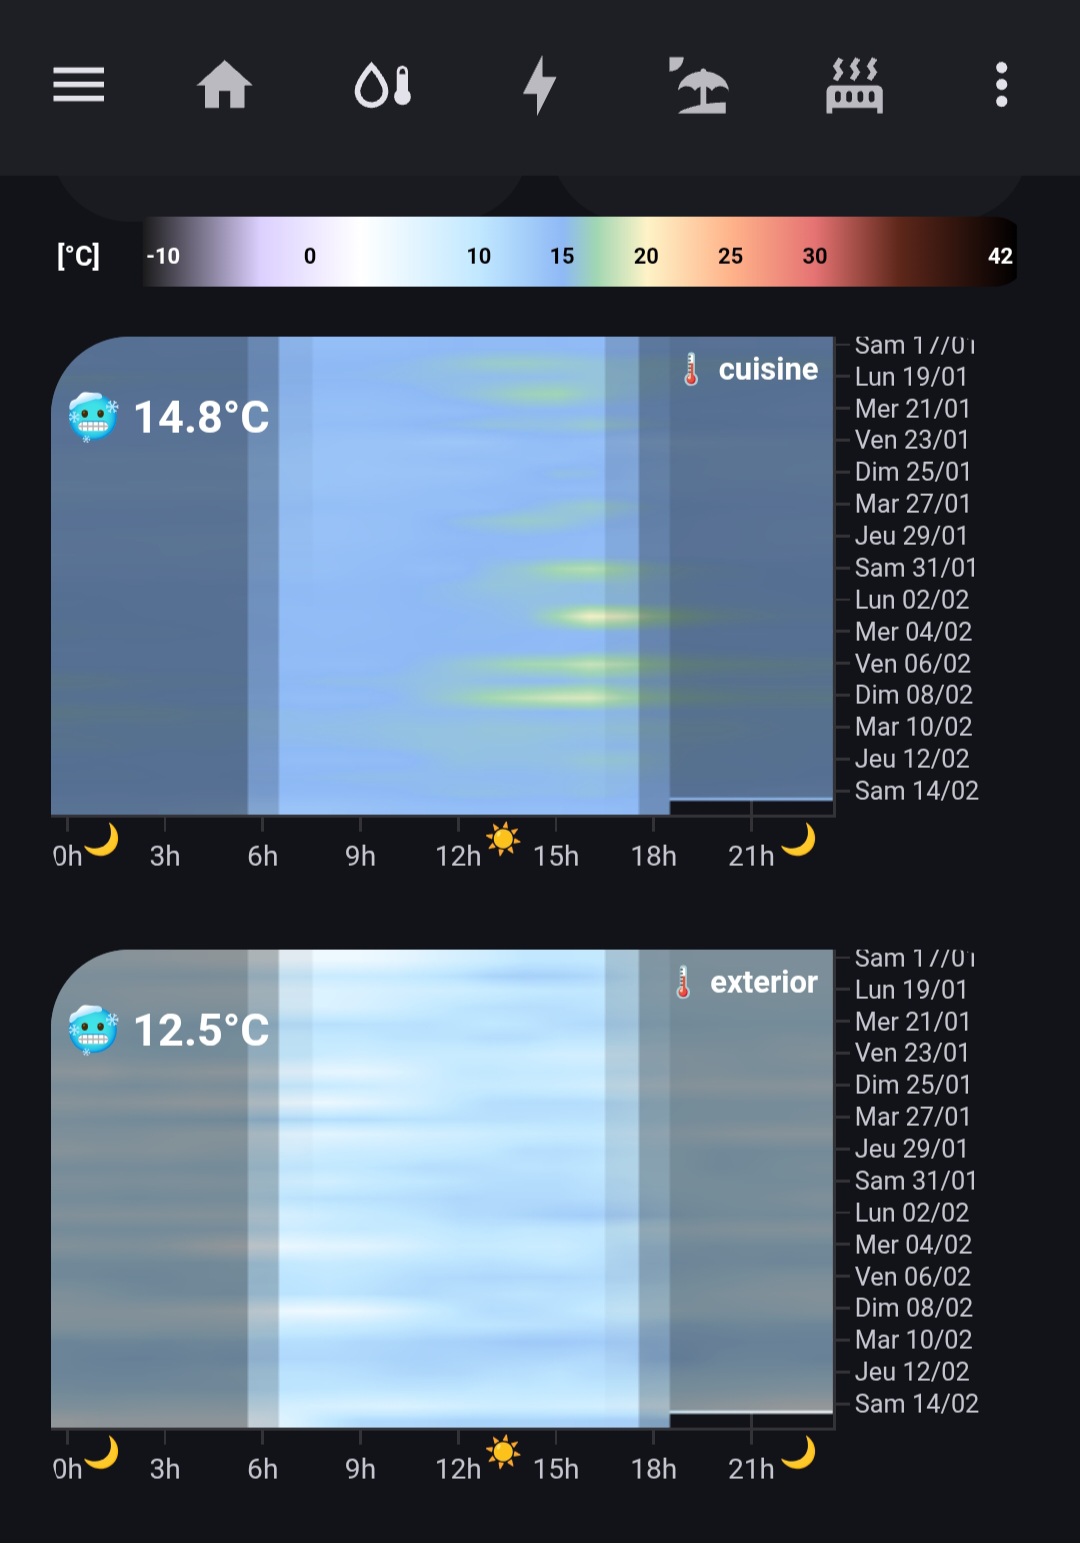
Colorbar for temperatures was the most important customization part: detailed variations around typical temperatures for winter and summer + consistent with thermal sensation (from snowy to burning temperatures) + avoiding too much agressive reds or other basic colors.
the nice colorbar code 🎨
type: picture-elements
image: >-
  data:image/svg+xml,%3Csvg%20width%3D%22800%22%20height%3D%2280%22%20xmlns%3D%22http%3A%2F%2Fwww.w3.org%2F2000%2Fsvg%22%3E%3Cdefs%3E%3ClinearGradient%20id%3D%22tempGradient%22%20x1%3D%220%25%22%20y1%3D%220%25%22%20x2%3D%22100%25%22%20y2%3D%220%25%22%3E%3Cstop%20offset%3D%220%25%22%20style%3D%22stop-color%3A%231a1a1a%3Bstop-opacity%3A1%22%2F%3E%3Cstop%20offset%3D%2213.5%25%22%20style%3D%22stop-color%3A%23dcd0ff%3Bstop-opacity%3A1%22%2F%3E%3Cstop%20offset%3D%2225%25%22%20style%3D%22stop-color%3A%23ffffff%3Bstop-opacity%3A1%22%2F%3E%3Cstop%20offset%3D%2238.5%25%22%20style%3D%22stop-color%3A%23c1e8ff%3Bstop-opacity%3A1%22%2F%3E%3Cstop%20offset%3D%2248.1%25%22%20style%3D%22stop-color%3A%238eb9f5%3Bstop-opacity%3A1%22%2F%3E%3Cstop%20offset%3D%2251.9%25%22%20style%3D%22stop-color%3A%23a1d6b2%3Bstop-opacity%3A1%22%2F%3E%3Cstop%20offset%3D%2257.7%25%22%20style%3D%22stop-color%3A%23fef3c7%3Bstop-opacity%3A1%22%2F%3E%3Cstop%20offset%3D%2267.3%25%22%20style%3D%22stop-color%3A%23ffb38a%3Bstop-opacity%3A1%22%2F%3E%3Cstop%20offset%3D%2276.9%25%22%20style%3D%22stop-color%3A%23e57373%3Bstop-opacity%3A1%22%2F%3E%3Cstop%20offset%3D%2286.5%25%22%20style%3D%22stop-color%3A%235e271a%3Bstop-opacity%3A1%22%2F%3E%3Cstop%20offset%3D%22100%25%22%20style%3D%22stop-color%3A%23000000%3Bstop-opacity%3A1%22%2F%3E%3C%2FlinearGradient%3E%3C%2Fdefs%3E%3Crect%20x%3D%2275%22%20y%3D%220%22%20width%3D%22715%22%20height%3D%2260%22%20fill%3D%22url(%23tempGradient)%22%20rx%3D%224%22%2F%3E%3Ctext%20x%3D%225%22%20y%3D%2240%22%20font-family%3D%22Arial%22%20font-size%3D%2222%22%20fill%3D%22white%22%20text-anchor%3D%22start%22%20font-weight%3D%22bold%22%3E%5B°C%5D%3C%2Ftext%3E%3Ctext%20x%3D%2278%22%20y%3D%2238%22%20font-family%3D%22Arial%22%20font-size%3D%2218%22%20fill%3D%22white%22%20text-anchor%3D%22start%22%20font-weight%3D%22bold%22%3E-10%3C%2Ftext%3E%3Ctext%20x%3D%22212%22%20y%3D%2238%22%20font-family%3D%22Arial%22%20font-size%3D%2218%22%20fill%3D%22black%22%20text-anchor%3D%22middle%22%20font-weight%3D%22bold%22%3E0%3C%2Ftext%3E%3Ctext%20x%3D%22350%22%20y%3D%2238%22%20font-family%3D%22Arial%22%20font-size%3D%2218%22%20fill%3D%22black%22%20text-anchor%3D%22middle%22%20font-weight%3D%22bold%22%3E10%3C%2Ftext%3E%3Ctext%20x%3D%22418%22%20y%3D%2238%22%20font-family%3D%22Arial%22%20font-size%3D%2218%22%20fill%3D%22black%22%20text-anchor%3D%22middle%22%20font-weight%3D%22bold%22%3E15%3C%2Ftext%3E%3Ctext%20x%3D%22487%22%20y%3D%2238%22%20font-family%3D%22Arial%22%20font-size%3D%2218%22%20fill%3D%22black%22%20text-anchor%3D%22middle%22%20font-weight%3D%22bold%22%3E20%3C%2Ftext%3E%3Ctext%20x%3D%22556%22%20y%3D%2238%22%20font-family%3D%22Arial%22%20font-size%3D%2218%22%20fill%3D%22black%22%20text-anchor%3D%22middle%22%20font-weight%3D%22bold%22%3E25%3C%2Ftext%3E%3Ctext%20x%3D%22625%22%20y%3D%2238%22%20font-family%3D%22Arial%22%20font-size%3D%2218%22%20fill%3D%22black%22%20text-anchor%3D%22middle%22%20font-weight%3D%22bold%22%3E30%3C%2Ftext%3E%3Ctext%20x%3D%22787%22%20y%3D%2238%22%20font-family%3D%22Arial%22%20font-size%3D%2218%22%20fill%3D%22white%22%20text-anchor%3D%22end%22%20font-weight%3D%22bold%22%3E42%3C%2Ftext%3E%3C%2Fsvg%3E
elements: []
card_mod:
  style: |
    ha-card {
      background: transparent !important;
      box-shadow: none !important;
      padding: 0px !important;
      margin-top: -10px !important;
    }
    img {
      display: block;
      margin-top: -5px !important;
    }
grid_options:
  columns: full
🌡️ And the heatmap (adapt the sensor name at the begining)
type: custom:plotly-graph
entities:
  - entity: sensor.cuisine_temperature
    statistic: mean
    period: hour
    internal: true
    fn: |-
      $fn ({ xs, ys, vars }) => {
        // --- CONFIGURATION ---
        const NB_JOURS = 30;
        vars.displayTitle = '🌡️ cuisine';
        const jours = ['Dim', 'Lun', 'Mar', 'Mer', 'Jeu', 'Ven', 'Sam'];

        // --- CALCUL CONFORT ---
        const currentT = ys[ys.length - 1];
        let emoji = '';
        if (currentT < 18) emoji = '🥶';
        else if (currentT < 20) emoji = '🧣';
        else if (currentT < 25) emoji = '😄';
        else if (currentT < 28) emoji = '😎';
        else emoji = '🥵';
        vars.currentStatus = `${emoji} ${currentT.toFixed(1)}°C`;

        // --- MAPPING HEATMAP ---
        const dataMap = {};
        xs.forEach((timestamp, i) => {
          const d = new Date(timestamp);
          const lbl = `${jours[d.getUTCDay()]} ${String(d.getUTCDate()).padStart(2, '0')}/${String(d.getUTCMonth() + 1).padStart(2, '0')}`;
          const h = d.getUTCHours();
          if (!dataMap[lbl]) dataMap[lbl] = new Array(24).fill(null);
          dataMap[lbl][h] = parseFloat(ys[i]);
        });

        vars.tempZ = Object.values(dataMap).slice(-NB_JOURS);
        vars.yLabels = Object.keys(dataMap).slice(-NB_JOURS);
        vars.xLabels = Array.from({length: 24}, (_, i) => i);
      }
  - entity: sensor.sun_solar_elevation
    statistic: mean
    period: hour
    internal: true
    fn: |-
      $fn ({ xs, ys, vars }) => {
        const dataMap = {};
        xs.forEach((timestamp, i) => {
          const d = new Date(timestamp);
          const lbl = `${['Dim', 'Lun', 'Mar', 'Mer', 'Jeu', 'Ven', 'Sam'][d.getUTCDay()]} ${String(d.getUTCDate()).padStart(2, '0')}/${String(d.getUTCMonth() + 1).padStart(2, '0')}`;
          const h = d.getUTCHours();
          if (!dataMap[lbl]) dataMap[lbl] = new Array(24).fill(null);
          dataMap[lbl][h] = parseFloat(ys[i]) < 0 ? parseFloat(ys[i]) : null;
        });
        vars.nightZ = Object.values(dataMap).slice(-vars.tempZ.length);
      }
  - entity: ""
    z: $fn ({ vars }) => vars.tempZ
    x: $fn ({ vars }) => vars.xLabels
    "y": $fn ({ vars }) => vars.yLabels
    type: heatmap
    zsmooth: best
    colorscale:
      - - 0
        - "#1a1a1a"
      - - 0.135
        - "#dcd0ff"
      - - 0.25
        - "#ffffff"
      - - 0.385
        - "#c1e8ff"
      - - 0.481
        - "#8eb9f5"
      - - 0.519
        - "#a1d6b2"
      - - 0.577
        - "#fef3c7"
      - - 0.673
        - "#ffb38a"
      - - 0.769
        - "#e57373"
      - - 0.865
        - "#5e271a"
      - - 1
        - "#000000"
    zmin: -10
    zmax: 42
    showscale: false
    hovertemplate: "%{z:.1f}°C<br>%{y}<br>%{x}h<extra></extra>"
  - entity: ""
    z: $fn ({ vars }) => vars.nightZ
    x: $fn ({ vars }) => vars.xLabels
    "y": $fn ({ vars }) => vars.yLabels
    type: heatmap
    zsmooth: false
    colorscale:
      - - 0
        - rgba(0, 0, 0, 0.4)
      - - 1
        - rgba(0, 0, 0, 0)
    zmin: -18
    zmax: 0
    showscale: false
    hoverinfo: skip
    hovertemplate: ""
hours_to_show: 60d
layout:
  paper_bgcolor: rgba(0,0,0,0)
  plot_bgcolor: rgba(0,0,0,0)
  margin:
    l: 0
    r: 70
    t: 0
    b: 30
  height: 200
  showlegend: false
  annotations:
    - text: $fn ({ vars }) => vars.displayTitle
      xref: paper
      yref: paper
      x: 0.99
      "y": 0.98
      xanchor: right
      yanchor: top
      showarrow: false
      font:
        size: 11
        color: white
        weight: bold
    - text: $fn ({ vars }) => vars.currentStatus
      xref: paper
      yref: paper
      x: 0.01
      "y": 0.9
      xanchor: left
      yanchor: top
      showarrow: false
      font:
        size: 16
        color: white
        weight: bold
    - text: 🌙
      x: 1.05
      "y": -0.1
      xref: x
      yref: paper
      showarrow: false
      font:
        size: 11
    - text: ☀️
      x: 13.4
      "y": -0.1
      xref: x
      yref: paper
      showarrow: false
      font:
        size: 11
    - text: 🌙
      x: 22.5
      "y": -0.1
      xref: x
      yref: paper
      showarrow: false
      font:
        size: 11
  xaxis:
    type: linear
    tickmode: array
    tickvals:
      - 0
      - 3
      - 6
      - 9
      - 12
      - 15
      - 18
      - 21
    ticktext:
      - 0h
      - 3h
      - 6h
      - 9h
      - 12h
      - 15h
      - 18h
      - 21h
    range:
      - -0.5
      - 23.5
    tickfont:
      size: 10
      color: var(--primary-text-color)
    fixedrange: true
  yaxis:
    type: category
    autorange: reversed
    tickfont:
      size: 9
      color: var(--primary-text-color)
    fixedrange: true
    side: right
  dragmode: false
card_mod:
  style: |
    ha-card {
      padding: 0px !important;
    }
    .main-svg {
      top: -10px !important;
    }
    .bg {
      transform: translateY(-10px);
    }
grid_options:
  columns: full
You need only: