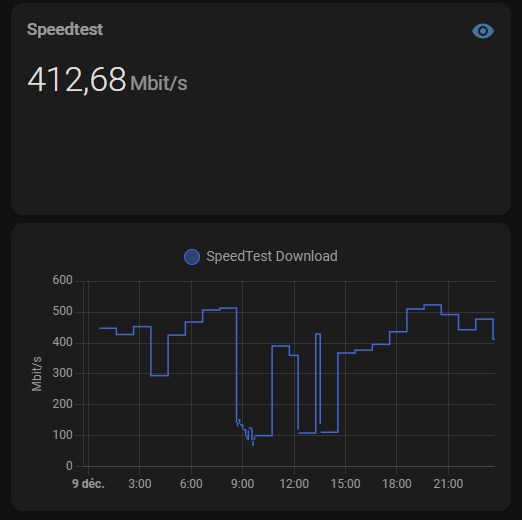
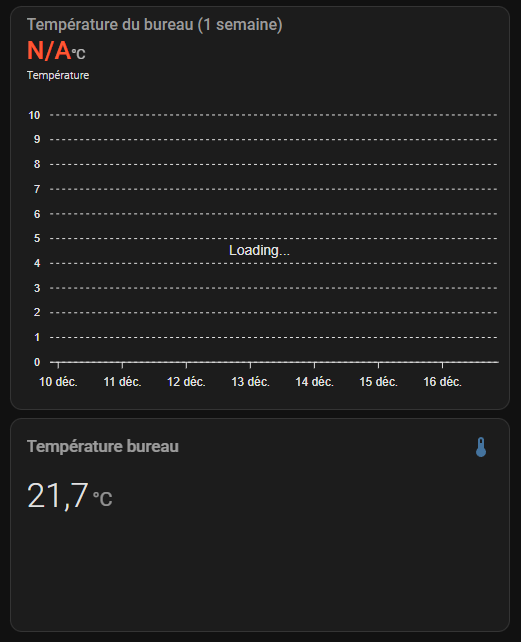
I just noticed that I no longer have curves on my mini-graph-card charts (and on my Apexcharts cards too, it just says “loading” without ever displaying anything)
I’ve done a lot of reboots on my HA Yellow today; could that have an impact?
I’ve tried rebooting my HA Yellow box several times, reinstalling the mini-graph-cards, and testing with several different sensors, clean cache, check on PC, Smartphone and tablet but without success.
Does anyone have an idea?
Thank you very much for your help.
System Information
version
core-2024.12.1
installation_type
Home Assistant OS
dev
false
hassio
true
docker
true
user
root
virtualenv
false
python_version
3.13.0
os_name
Linux
os_version
6.6.51-haos-raspi
arch
aarch64
timezone
Europe/Zurich
config_dir
/config
Home Assistant Community Store
GitHub API
ok
GitHub Content
ok
GitHub Web
ok
HACS Data
ok
GitHub API Calls Remaining
5000
Installed Version
2.0.1
Stage
running
Available Repositories
1488
Downloaded Repositories
87
AccuWeather
can_reach_server
ok
remaining_requests
45
Home Assistant Cloud
logged_in
true
subscription_expiration
private
relayer_connected
true
relayer_region
eu-central-1
remote_enabled
true
remote_connected
true
alexa_enabled
false
google_enabled
true
cloud_ice_servers_enabled
true
remote_server
private
certificate_status
ready
instance_id
private
can_reach_cert_server
ok
can_reach_cloud_auth
ok
can_reach_cloud
ok
Home Assistant Supervisor
host_os
Home Assistant OS 14.0
update_channel
stable
supervisor_version
supervisor-2024.11.4
agent_version
1.6.0
docker_version
27.2.0
disk_total
229.2 GB
disk_used
41.5 GB
healthy
true
supported
true
host_connectivity
true
supervisor_connectivity
true
ntp_synchronized
true
virtualization
board
yellow
supervisor_api
ok
version_api
ok
installed_addons
Samba share (12.3.2), Advanced SSH & Web Terminal (19.0.0), Home Assistant Google Drive Backup (0.112.1), Grafana (10.2.2), Matter Server (6.6.1), Piper (1.5.2), Whisper (2.3.0), VLC (0.3.0), InfluxDB (5.0.1), Z-Wave JS UI (3.18.0), Studio Code Server (5.17.3), Mosquitto broker (6.4.1), Zigbee2MQTT (1.42.0-2), Silicon Labs Flasher (0.3.2), Samba Backup (5.2.0), openWakeWord (1.10.0), ESPHome Device Compiler (2024.11.3), Uptime Kuma (0.12.4), OpenThread Border Router (2.12.2), Music Assistant Server (beta) (2.4.0b7), Glances (0.21.1)
And can you see same with a stock history-graph?
Btw, mini-graph-card uses a browser’s cache - so purge it just in case.
And checking HA log is always useful.
I use Apex charts for displaying electricity prices and that graph pretty much always fail to display the first time I open the page.
If I refresh the page then it shows.
I have disabled the browser cache for the HA URL, so nothing will ever be cached.
My problem is that it’s not only ApexCharts but all the card who render graph. And it is not only on a Navigator that’s happened, but on my smartphone it’s the same issue
But, for the futur, I’ll do it like you and remove the cache of my Chrome
Something strange, I tried yesterday to restore backup from 5 days to now. Every restore I made give me back and running the graphs, so I restored the last I made yesterday and everithing was back and running BUT this morning when I woke up, bam, no graph again !?
I found something, this problem happened when I upgrade from the core 2024.11.3 to 2024.12.3. I dont see any difference in the history data, all seems to be OK
I updated to 2024.12.4 this morning and then tried to create a new Apexcharts graph, but it is stuck loading!
As shown in the image, older graphs are still rendering well.