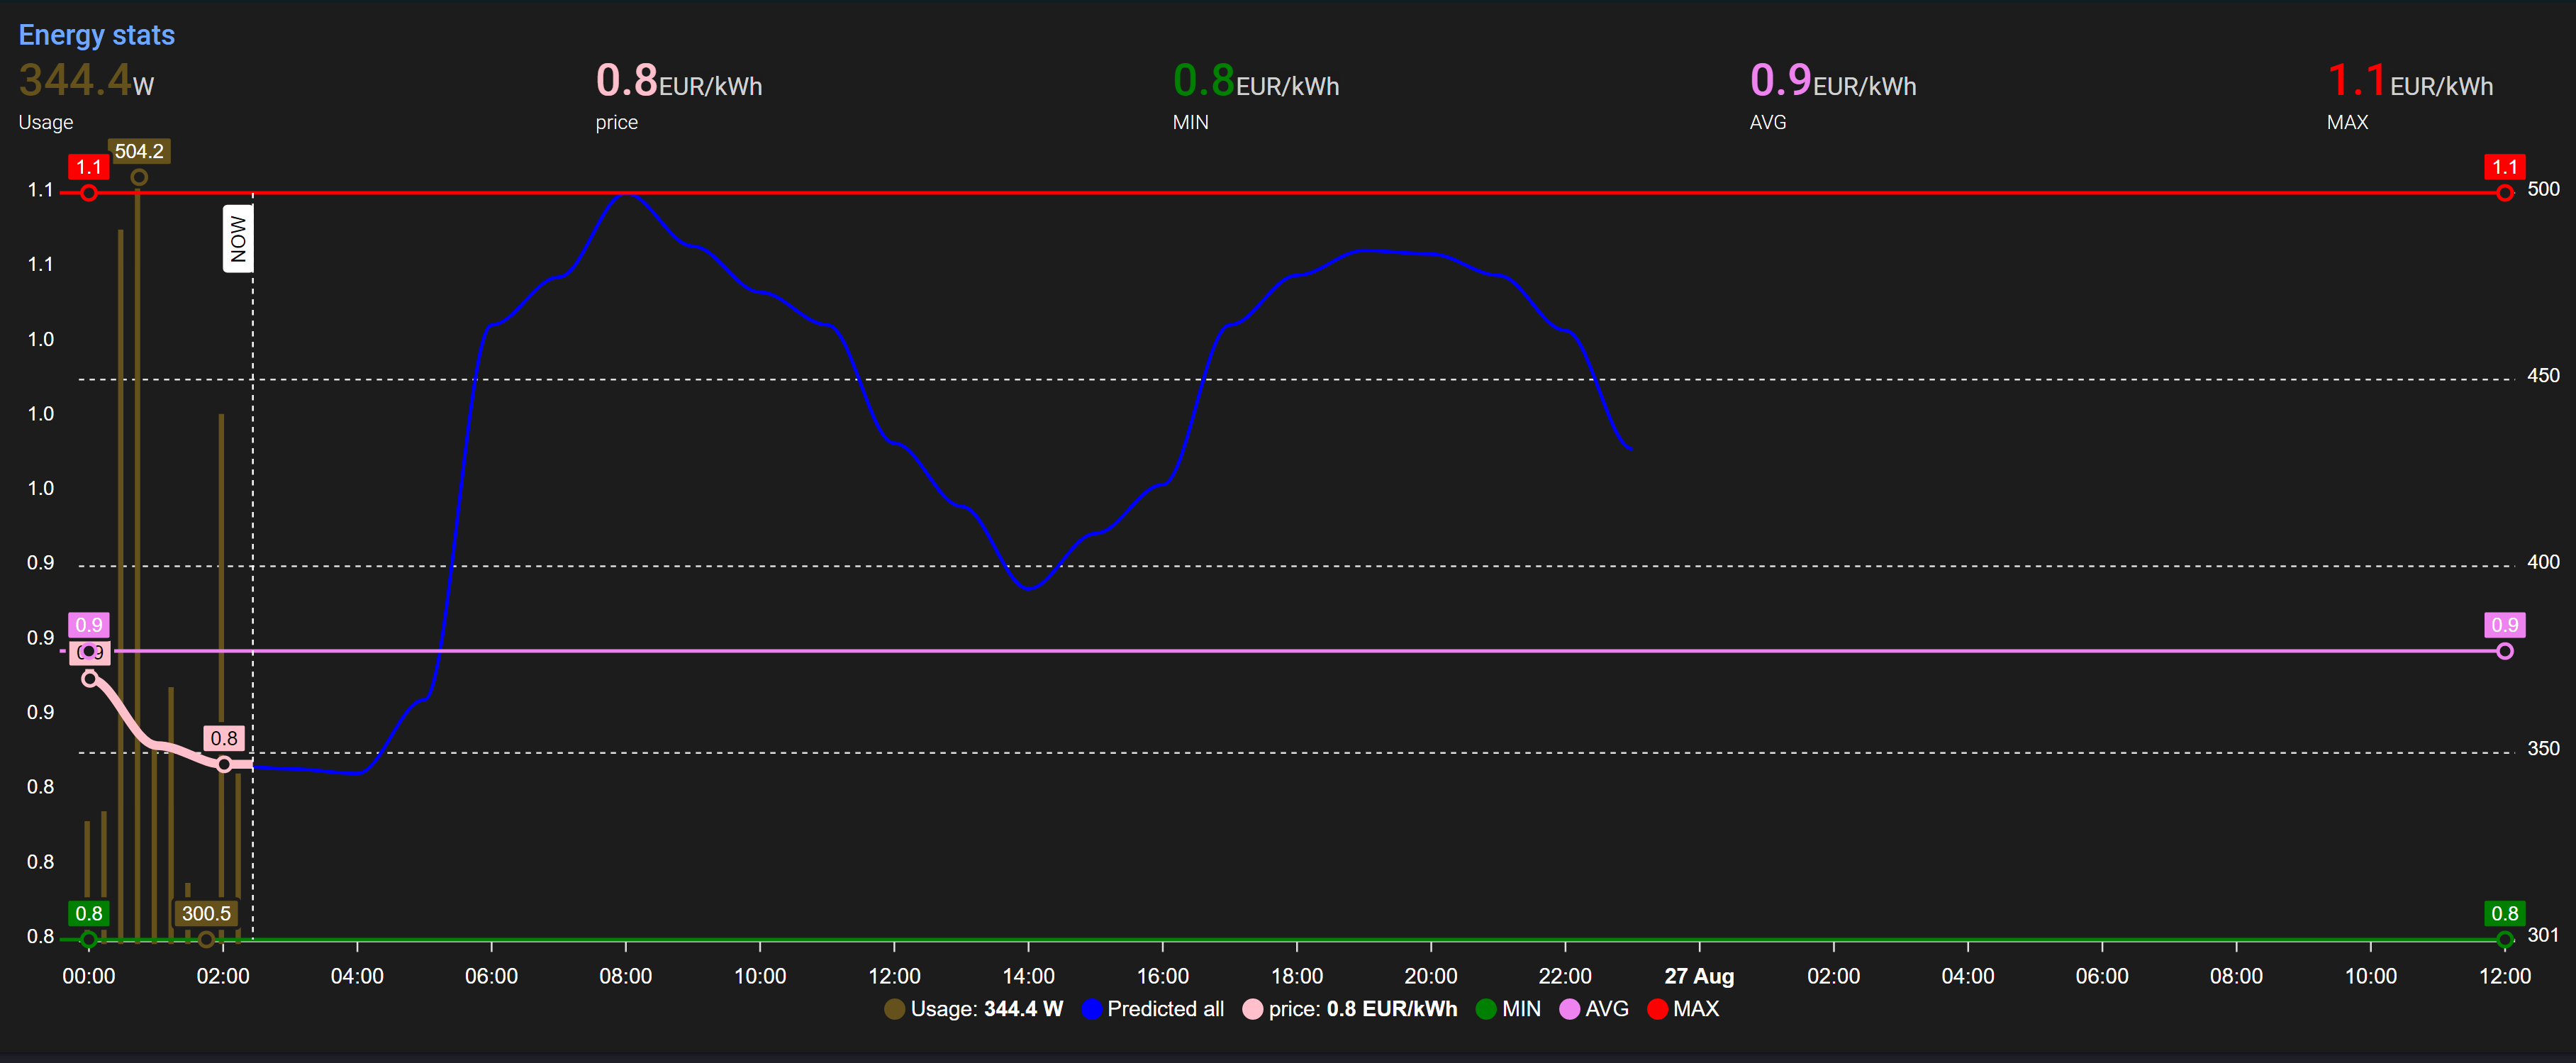
If anybody is interested in native HA solution using rest api, tibber sensor and apex charts, below is the code:
REST Sensor:
You need to replace [YOUR AUTH CODE FROM TIBBER DEVELOPER PROFILE] with your access token from tibber dev profile
- platform: rest
  name: Tibber prices
  resource: https://api.tibber.com/v1-beta/gql
  method: POST
  scan_interval: 60
  payload: '{ "query": "{ viewer { homes { currentSubscription { priceInfo { today { total startsAt } tomorrow { total startsAt }}}}}}" }'
  json_attributes_path: "$.data.viewer.homes[0].currentSubscription.priceInfo"
  json_attributes:
    - today
    - tomorrow
  value_template: Ok
  headers:
    Authorization: "**[YOUR AUTH CODE FROM TIBBER DEVELOPER PROFILE]**"
    Content-Type: application/json
    User-Agent: REST
Apex charts YAML
type: custom:apexcharts-card
apex_config:
  chart:
    height: 500px
header:
  show: true
  title: Energy stats
  show_states: true
  colorize_states: true
now:
  show: true
  color: white
  label: NOW
hours_12: false
graph_span: 36h
span:
  start: day
yaxis:
  - id: kWh
    decimals: 0
    opposite: true
    max: 500
    apex_config:
      tickAmount: 4
  - id: EUR
series:
  - entity: sensor.**[YOUR TIBBER ENERGY USAGE SENSOR]**
    type: column
    show:
      extremas: true
    name: Usage
    stroke_width: 2
    color: '#64511c'
    opacity: 0.3
    yaxis_id: kWh
    group_by:
      func: avg
      duration: 15min
  - entity: sensor.tibber_prices
    stroke_width: 2
    color: blue
    curve: smooth
    show:
      legend_value: false
      extremas: true
      in_header: false
    extend_to: now
    yaxis_id: EUR
    name: Predicted all
    data_generator: |
      return entity.attributes.today.map((entry) => {
        return [new Date(entry.startsAt), entry.total];
      });
      return entity.attributes.tomorrow.map((entry) => {
        return [new Date(entry.startsAt), entry.total];
      });
  - entity: sensor.**[YOUR TIBBER PRICE SENSOR]**
    extend_to: now
    show:
      extremas: true
    color: pink
    stroke_width: 5
    yaxis_id: EUR
    name: price
  - entity: sensor.**[YOUR TIBBER PRICE SENSOR]**
    stroke_width: 2
    show:
      legend_value: false
      extremas: true
    curve: smooth
    attribute: min_price
    name: MIN
    color: green
    yaxis_id: EUR
    type: line
    group_by:
      duration: 24hours
      func: min
  - entity: sensor.**[YOUR TIBBER PRICE SENSOR]**
    stroke_width: 2
    yaxis_id: EUR
    name: AVG
    attribute: avg_price
    color: violet
    curve: smooth
    type: line
    show:
      legend_value: false
      extremas: true
    group_by:
      duration: 24hours
      func: avg
  - entity: sensor.**[YOUR TIBBER PRICE SENSOR]**
    attribute: max_price
    stroke_width: 2
    curve: smooth
    show:
      legend_value: false
      extremas: true
    name: MAX
    color: red
    yaxis_id: EUR
    type: line
    group_by:
      duration: 24hours
      func: max
You need to replace following sensors above:
- [YOUR TIBBER ENERGY USAGE SENSOR] - any sensor really showing your consumption
- [YOUR TIBBER PRICE SENSOR] - regular tibber sensor giving you the price (with mix, max, avg attributes)