I wonder if it is possible to get also future price for the tibber sensor.
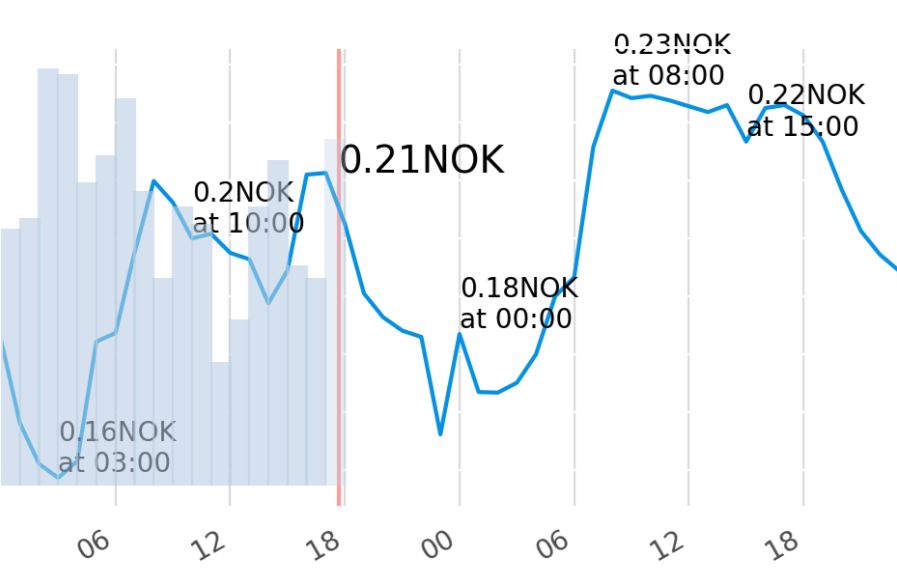
Today there is only a sensor showing the current price and the prices for current day, though with some insight of the day low/high ++. In the Tibber app there is a forecast for the rest of the day (not forecast, but actual cost tarriff for the next 24 hours).
Great Work Daniel!
Is there any possibility to add the functionality without using HACS?
I’m thinking of directly from github. (have had issues with HACS and haven’t installed it)
I got it to work a little better after deleting alla files and downloaded it again.
But now I dont get any image. Wonder if it could be related to that i tries to show a image which is formatted like this “prices_Lusseröd 219.png” with swedish character and spaces…
I would like to intergrate Tibber’s forecast prices in my Apex chart. I understand that forecast prices are not available as part of the Tibber integration. Could this be incorporated in the same way it was done for the electricity prices of Amber?
That is not an acceptable solution for an official integration in Home Assistant.
Currently, Home Assistant does not have any good way to handle future values.
OK, I guess it was accepted for Amber since it is a custom integration. I hope there will be a way to handle this in the future, with the incorporation of the energy dashboard forecast value for electricity is definitely something to look at.
I have this in my config to accommodate this need:
binary_sensor:
  - platform: template
    sensors:
      nordpool_cheapest_4_hours:
        value_template: >-
          {% set l=state_attr('sensor.nordpool_kwh_oslo_nok_2_10_025', 'raw_today')|sort(attribute='value') %}
          {{ (now() >= l[0].start and now() <= l[0].end)
            or (now() >= l[1].start and now() <= l[1].end)
            or (now() >= l[2].start and now() <= l[2].end)
            or (now() >= l[3].start and now() <= l[3].end) }}
      nordpool_cheapest_8_hours:
        value_template: >-
          {% set l=state_attr('sensor.nordpool_kwh_oslo_nok_2_10_025', 'raw_today')|sort(attribute='value') %}
          {{ (now() >= l[0].start and now() <= l[0].end)
            or (now() >= l[1].start and now() <= l[1].end)
            or (now() >= l[2].start and now() <= l[2].end)
            or (now() >= l[3].start and now() <= l[3].end)
            or (now() >= l[4].start and now() <= l[4].end)
            or (now() >= l[5].start and now() <= l[5].end)
            or (now() >= l[6].start and now() <= l[6].end)
            or (now() >= l[7].start and now() <= l[7].end) }}
      nordpool_cheapest_12_hours:
        value_template: >-
          {% set l=state_attr('sensor.nordpool_kwh_oslo_nok_2_10_025', 'raw_today')|sort(attribute='value') %}
          {{ (now() >= l[0].start and now() <= l[0].end)
            or (now() >= l[1].start and now() <= l[1].end)
            or (now() >= l[2].start and now() <= l[2].end)
            or (now() >= l[3].start and now() <= l[3].end)
            or (now() >= l[4].start and now() <= l[4].end)
            or (now() >= l[5].start and now() <= l[5].end)
            or (now() >= l[6].start and now() <= l[6].end)
            or (now() >= l[7].start and now() <= l[7].end)
            or (now() >= l[8].start and now() <= l[8].end)
            or (now() >= l[9].start and now() <= l[9].end)
            or (now() >= l[10].start and now() <= l[10].end)
            or (now() >= l[11].start and now() <= l[11].end) }}
This gives me a binary_sensor for the hours I am looking for. For instance I automate some of the heating in the house based on the 12 cheapest hours. Hope this helps!
I really like your solution for using Nordpool to fetch the cheapest hours.
I have added this binary_sensor to my own configuration.
There is one problem though.
First I get status ‘off’ for all three sensors, but after a short while (about 1minute max) these turn to status unavailable. The nordpool-integration is running and reporting data correctly though.
Nice , Works great, lets see tomorrow if the price is right ( for south Sweden region ) , current price looks as “default_sensor” … But i wondered how you got your “Consumption” into it, as i can see it in the app ( with 1 day relay ) , but maybe you have, your own device attached to the Grid-Provider ?
great, almost what I was looking for. Since this is for heating, I’d prefer looking at say the coming few hours. I would want to heat after the cheapest hour, but not right before. Also, would be interesting to calculate the hours before midnight taking the hours after into account. Found this
Appreciating you sharing your code. Trying to wrap my head around how to visualize this in the GUI. Any ideas how to make a diagram(time/price) or something similar for the 3 periods?


