Here is how I got the Nordpool core integration and Apexcharts working with todays and tomorrows prices.
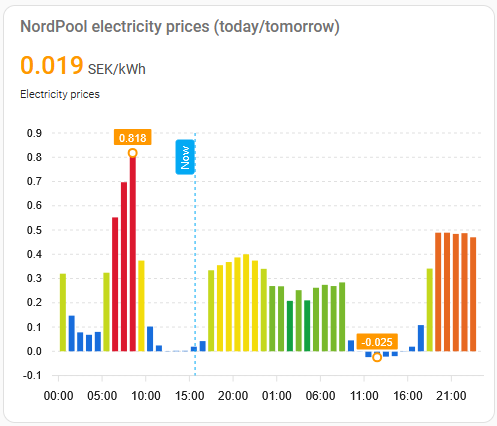
First I found a chart example that works for the custom nordpool integration here: https://gathering.tweakers.net/forum/list_message/73974776#73974776
The issue for me and others is/was that there is no attribute raw_today or row_tomorrow in the core integration.
Like @iculda I already had a working trigger template based on the example in: Nord Pool - Home Assistant
My trigger template looks like this:
template:
- trigger:
- trigger: time_pattern
minutes: /10
- trigger: homeassistant
event: start
action:
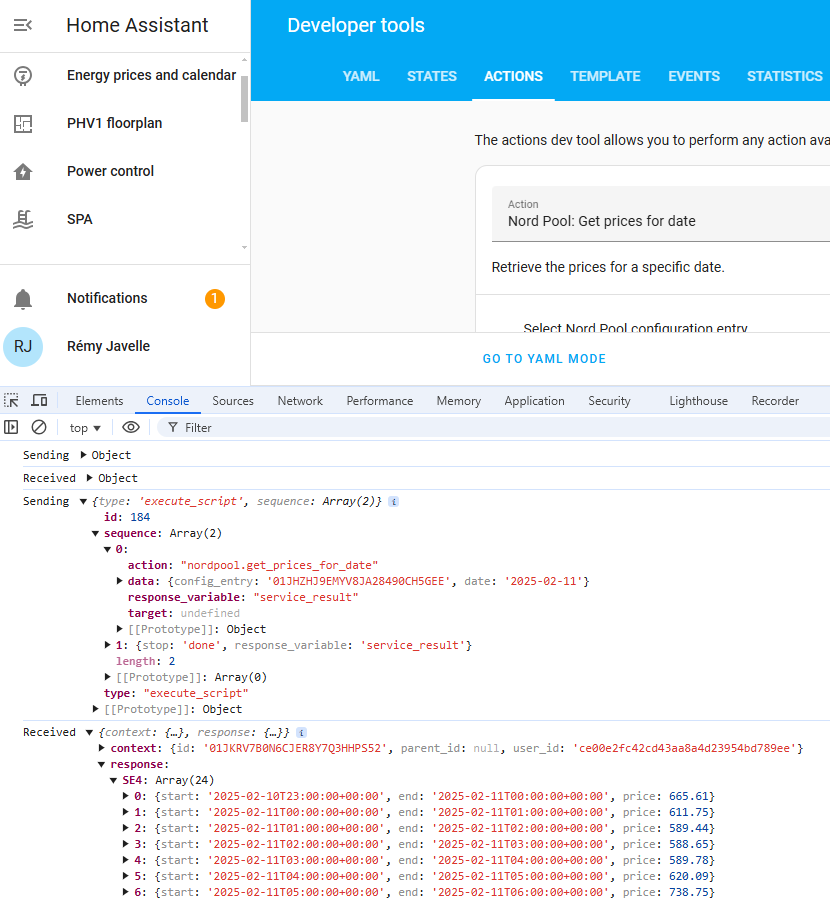
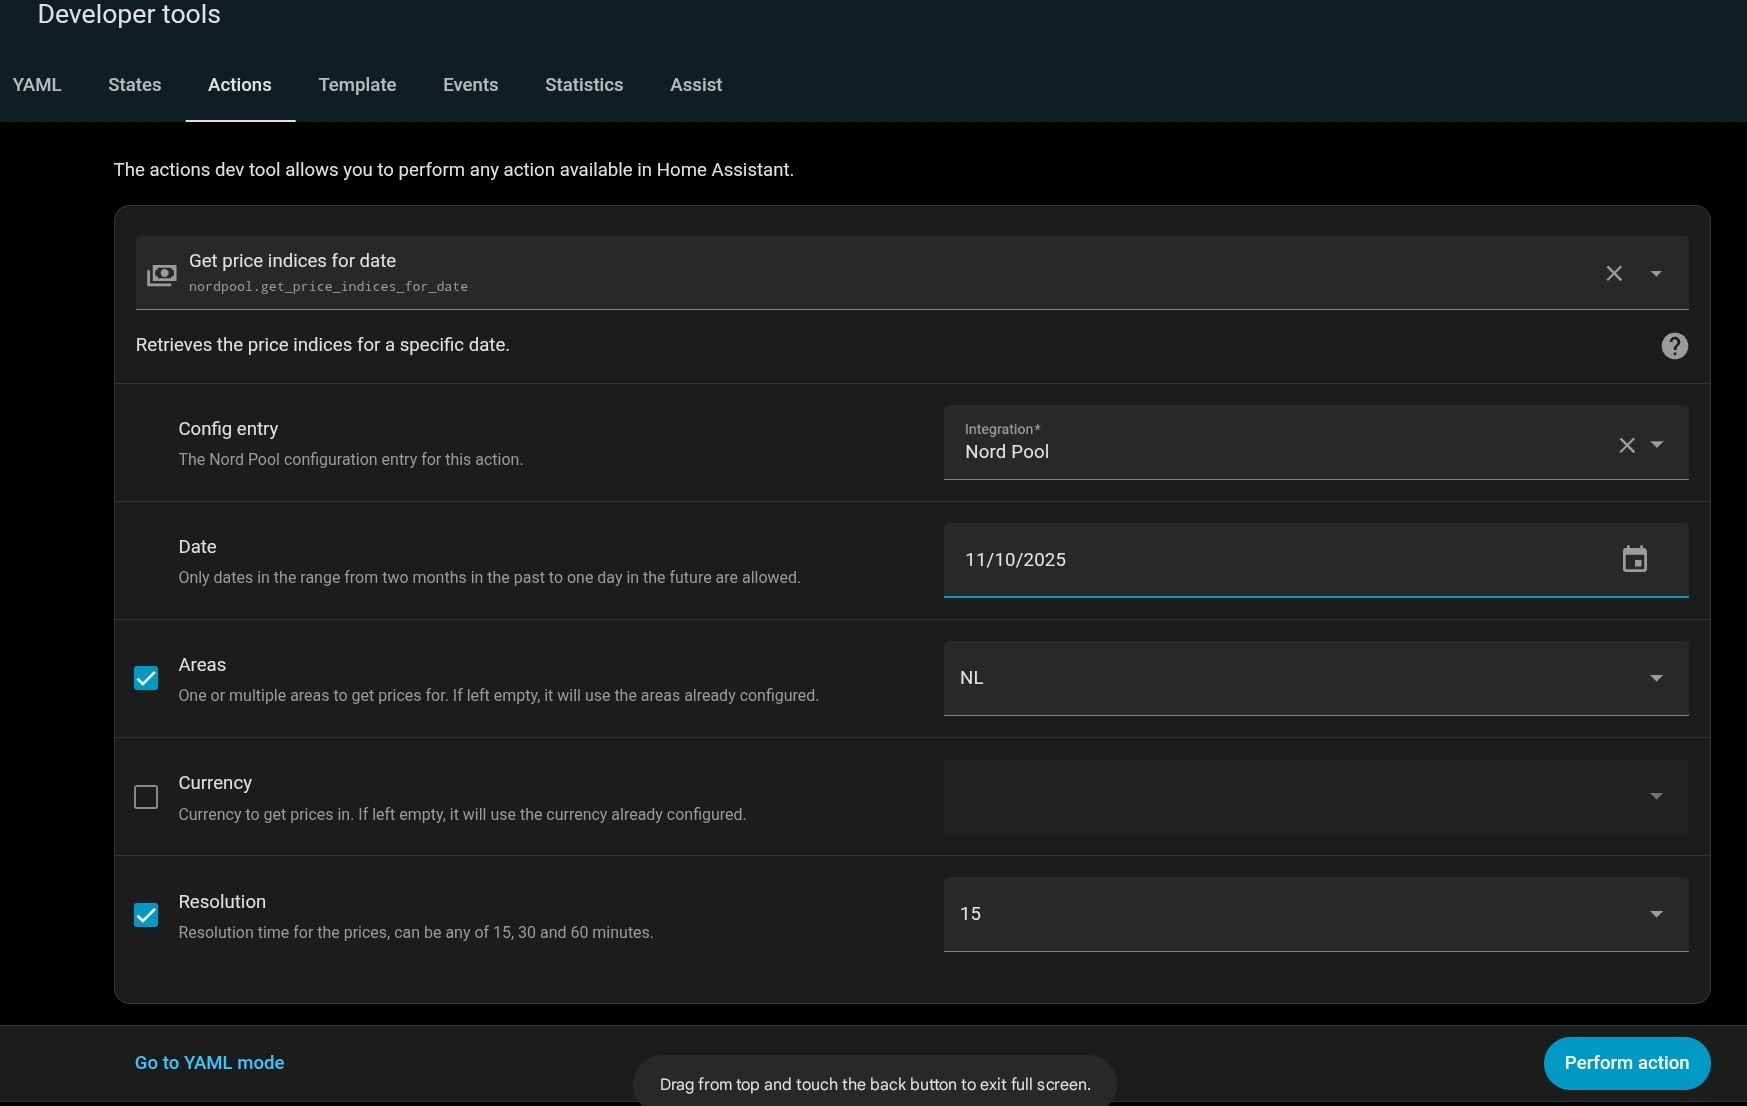
- action: nordpool.get_prices_for_date
data:
config_entry: REPLACE_WITH_YOUR_OWN_CONFIG_ENTRY
date: "{{ now().date() + timedelta(days=1) }}"
areas: NL
currency: EUR
response_variable: tomorrow_price
- action: nordpool.get_prices_for_date
data:
config_entry: REPLACE_WITH_YOUR_OWN_CONFIG_ENTRY
date: "{{ now().date() }}"
areas: NL
currency: EUR
response_variable: today_price
sensor:
- name: Tomorrow lowest price
unique_id: nl_tomorrow_low_price
unit_of_measurement: "EUR/kWh"
icon: mdi:cash
state: >
{% if tomorrow_price is mapping %}
{% set data = namespace(prices=[]) %}
{% set electricity_tax = states('input_number.electricity_tax') | float(0) %}
{% set purchase_costs = states('input_number.electricity_purchase_costs') | float(0) %}
{% for state in tomorrow_price['NL'] %}
{% set data.prices = data.prices + [((state.price/1000 + electricity_tax + purchase_costs) * 1.21) | round(3, default=0)] %}
{% endfor %}
{{min(data.prices)}}
{% else %}
unavailable
{% endif %}
attributes:
data: >
{% if tomorrow_price is mapping %}
{% set electricity_tax = states('input_number.electricity_tax') | float(0) %}
{% set purchase_costs = states('input_number.electricity_purchase_costs') | float(0) %}
{% set data = namespace(prices=[]) %}
{% for state in tomorrow_price['NL'] %}
{% set data.prices = data.prices + [{'start':state.start, 'end':state.end, 'price': ((state.price/1000 + electricity_tax + purchase_costs) * 1.21) | round(3, default=0)}] %}
{% endfor %}
{{data.prices}}
{% else %}
[]
{% endif %}
- name: Tomorrow highest price
unique_id: nl_tomorrow_high_price
unit_of_measurement: "EUR/kWh"
icon: mdi:cash
state: >
{% if tomorrow_price is mapping %}
{% set data = namespace(prices=[]) %}
{% set electricity_tax = states('input_number.electricity_tax') | float(0) %}
{% set purchase_costs = states('input_number.electricity_purchase_costs') | float(0) %}
{% for state in tomorrow_price['NL'] %}
{% set data.prices = data.prices + [((state.price/1000 + electricity_tax + purchase_costs) * 1.21) | round(3, default=0)] %}
{% endfor %}
{{max(data.prices)}}
{% else %}
unavailable
{% endif %}
attributes:
data: >
{% if tomorrow_price is mapping %}
{% set electricity_tax = states('input_number.electricity_tax') | float(0) %}
{% set purchase_costs = states('input_number.electricity_purchase_costs') | float(0) %}
{% set data = namespace(prices=[]) %}
{% for state in tomorrow_price['NL'] %}
{% set data.prices = data.prices + [{'start':state.start, 'end':state.end, 'price': ((state.price/1000 + electricity_tax + purchase_costs) * 1.21) | round(3, default=0)}] %}
{% endfor %}
{{data.prices}}
{% else %}
[]
{% endif %}
- name: Today prices
unique_id: nl_today_prices
unit_of_measurement: "EUR/kWh"
icon: mdi:cash
state: >
{% if today_price is mapping %}
{% set data = namespace(prices=[]) %}
{% set electricity_tax = states('input_number.electricity_tax') | float(0) %}
{% set purchase_costs = states('input_number.electricity_purchase_costs') | float(0) %}
{% for state in today_price['NL'] %}
{% set data.prices = data.prices + [((state.price/1000 + electricity_tax + purchase_costs) * 1.21) | round(3, default=0)] %}
{% endfor %}
{{min(data.prices)}}
{% else %}
unavailable
{% endif %}
attributes:
data: >
{% if today_price is mapping %}
{% set electricity_tax = states('input_number.electricity_tax') | float(0) %}
{% set purchase_costs = states('input_number.electricity_purchase_costs') | float(0) %}
{% set data = namespace(prices=[]) %}
{% for state in today_price['NL'] %}
{% set data.prices = data.prices + [{'start':state.start, 'end':state.end, 'price': ((state.price/1000 + electricity_tax + purchase_costs) * 1.21) | round(3, default=0)}] %}
{% endfor %}
{{data.prices}}
{% else %}
[]
{% endif %}
As you can see I have some sensors for the lowest price tomorrow and the highest price tomorrow. That already have an attribute called data with as contents something like this:
start: <date>, end: <date>, price: <in EUR/kWh including taxes, VAT and purchase costs>
So at first I changed the span, entity and data_generator part of the ApexChart definition to:
span:
  start: day
  offset: +1d
series:
  - entity: sensor.tomorrow_lowest_price
    data_generator: |
      return entity.attributes.data.map((start, index) => {
        return [new Date(start["start"]).getTime() + 1800000, entity.attributes.data[index]["price"]];
      });
Which resulted in this:
type: custom:apexcharts-card
experimental:
color_threshold: true
graph_span: 23h
header:
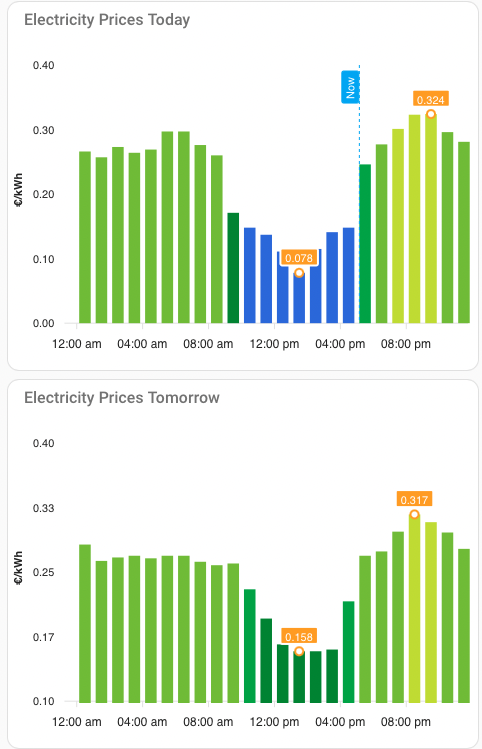
title: Electricity Prices Tomorrow
show: true
span:
start: day
offset: +1d
series:
- entity: sensor.tomorrow_lowest_price
type: column
show:
extremas: true
float_precision: 3
data_generator: |
return entity.attributes.data.map((start, index) => {
return [new Date(start["start"]).getTime() + 1800000, entity.attributes.data[index]["price"]];
});
color_threshold:
- value: 0
color: "#186ddc"
- value: 0.155
color: "#04822e"
- value: 0.2
color: "#12A141"
- value: 0.25
color: "#79B92C"
- value: 0.3
color: "#C4D81D"
- value: 0.35
color: "#F3DC0C"
- value: 0.4
color: "#EFA51E"
- value: 0.45
color: "#E76821"
- value: 0.5
color: "#DC182F"
yaxis:
- id: "1"
align_to: 0.1
decimals: 2
apex_config:
title:
text: €/kWh
tickAmount: 4
apex_config:
xaxis:
type: datetime
tooltip:
enabled: false
tooltip:
enabled: true
x:
show: true
fixed:
enabled: true
position: topLeft
chart:
height: 320px
grid:
show: true
borderColor: rgba(255,255,255,0.1)
And that gave me the correct prices for tomorrow. Then I still was missing the today_prices so I added the following sensor to my template trigger:
      - name: Today prices
        unique_id: nl_today_prices
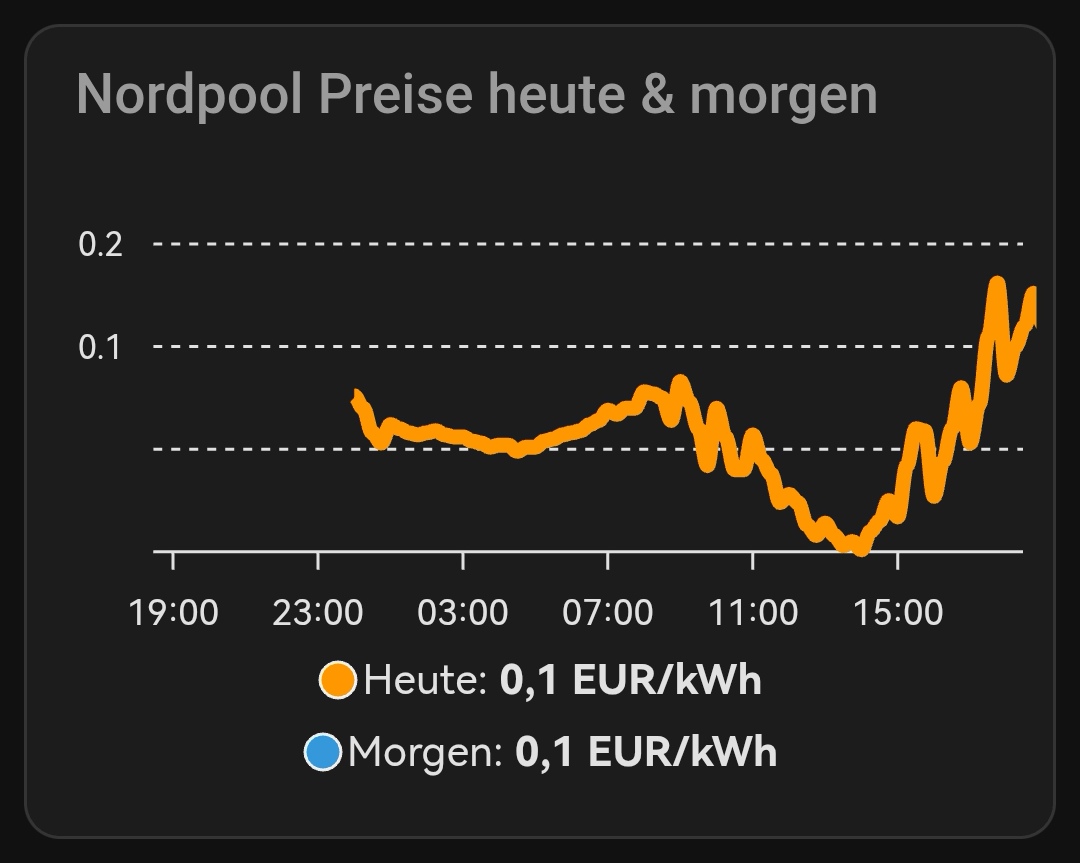
With the chart definition like this gave me the graph I wanted:
type: custom:apexcharts-card
experimental:
  color_threshold: true
graph_span: 23h
header:
  title: Electricity Prices Today
  show: true
span:
  start: day
now:
  show: true
  label: Now
series:
  - entity: sensor.today_prices
    type: column
    show:
      extremas: true
    float_precision: 3
    data_generator: |
      return entity.attributes.data.map((start, index) => {
        return [new Date(start["start"]).getTime() + 1800000, entity.attributes.data[index]["price"]];
      });
    color_threshold:
      - value: 0
        color: "#186ddc"
      - value: 0.155
        color: "#04822e"
      - value: 0.2
        color: "#12A141"
      - value: 0.25
        color: "#79B92C"
      - value: 0.3
        color: "#C4D81D"
      - value: 0.35
        color: "#F3DC0C"
      - value: 0.4
        color: "#EFA51E"
      - value: 0.45
        color: "#E76821"
      - value: 0.5
        color: "#DC182F"
yaxis:
  - id: "1"
    align_to: 0.1
    decimals: 2
    apex_config:
      title:
        text: €/kWh
      tickAmount: 4
apex_config:
  xaxis:
    type: datetime
    tooltip:
      enabled: false
  tooltip:
    enabled: true
    x:
      show: true
    fixed:
      enabled: true
      position: topLeft
  chart:
    height: 320px
  grid:
    show: true
    borderColor: rgba(255,255,255,0.1)
See this picture:
The only thing that do not quite understand is why fetching the data in developer tools works immediately and with the template trigger it didn’t return data until the data for tomorrow was available. Restarting HA Core didn’t update the sensor today_prices (nor just reloading template entitities: Developer Tools–> Yaml → YAML configuration reloading → TEMPLATE ENTITIES).
My guess is that the action part of the template trigger wasn’t able to ge the prices for tomorrow and thus didn’t do to the next action as well. But I am not sure. At 12:50 today the prices for tomorrow were there and my sensor for today_prices was also populated.
When working on the high and low sensors a few weeks ago I got the impression that some data is cached thus not executing the api for nordpool every 10 minutes like the trigger suggests. But I am not sure of this.
Hopefully this helps others trying to get these nice graphs with the core integration working as well.